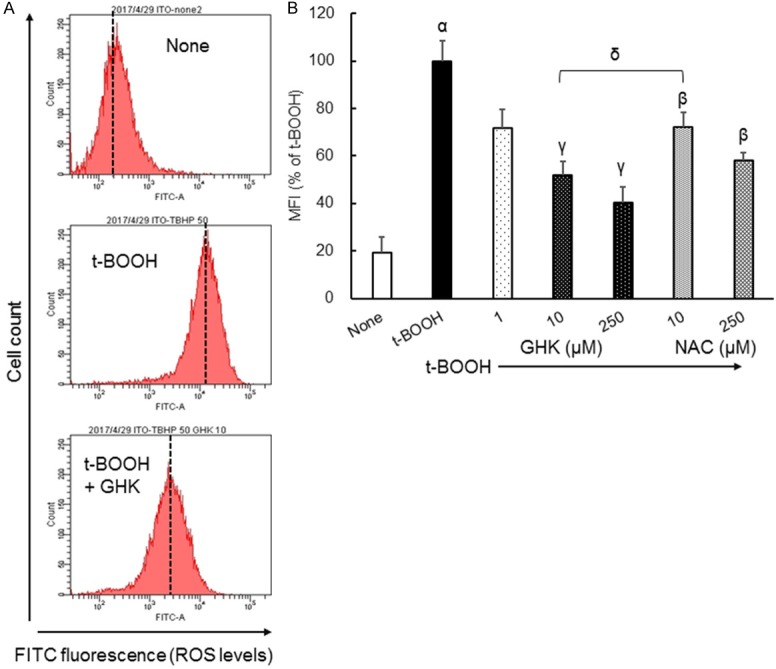
Figure 1.

Alterations in ROS levels in Caco-2 cells treated with t-BOOH in combination with GHK. (A) Representative univariate histograms of flow cytometry data. (B) Quantitative assessment of the MFI flow cytometry data. Results are presented as means ± standard errors of the mean (n = 3-12). α P < 0.01 vs. None. β P < 0.01, γ P < 0.01 vs. t-BOOH. δ P < 0.01 vs. NAC. MFI, mean fluorescence intensity (shown as dashed lines in part A); GHK, glycyl-ʟ-histidyl-ʟ-lysine; t-BOOH, tert-butylhydroperoxide; NAC, N-acetyl-ʟ-cysteine.
