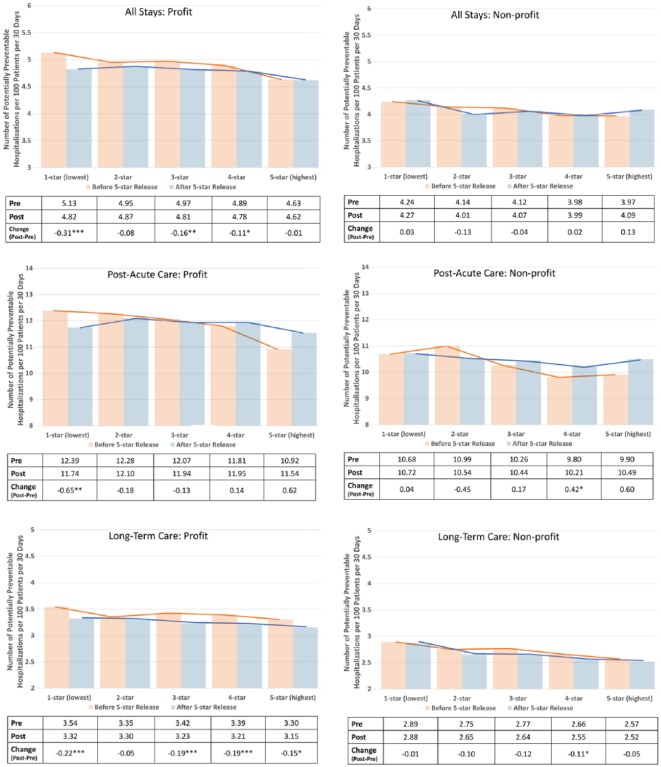
Figure 2.
Difference in the number of potentially preventable hospitalizations per 100 patients per 30 days post vs pre 5-star, stratified by profit status.
Note. The bars represent risk-adjusted hospitalization rates before and after 5-star release for each nursing home star rating. The difference between the bars listed in the table below is the sum of the coefficients on the interaction Rating × Post and the main Post effect and represents the difference in hospitalization rates attributable to the implementation of 5-star reporting, after adjusting for time trends and differences in hospitalization rates. P values refer to statistical significance of the difference between pre-5-star and post-5-star hospitalizations rates compared with zero.
*p < .1. **p < .01. ***p < .001.

