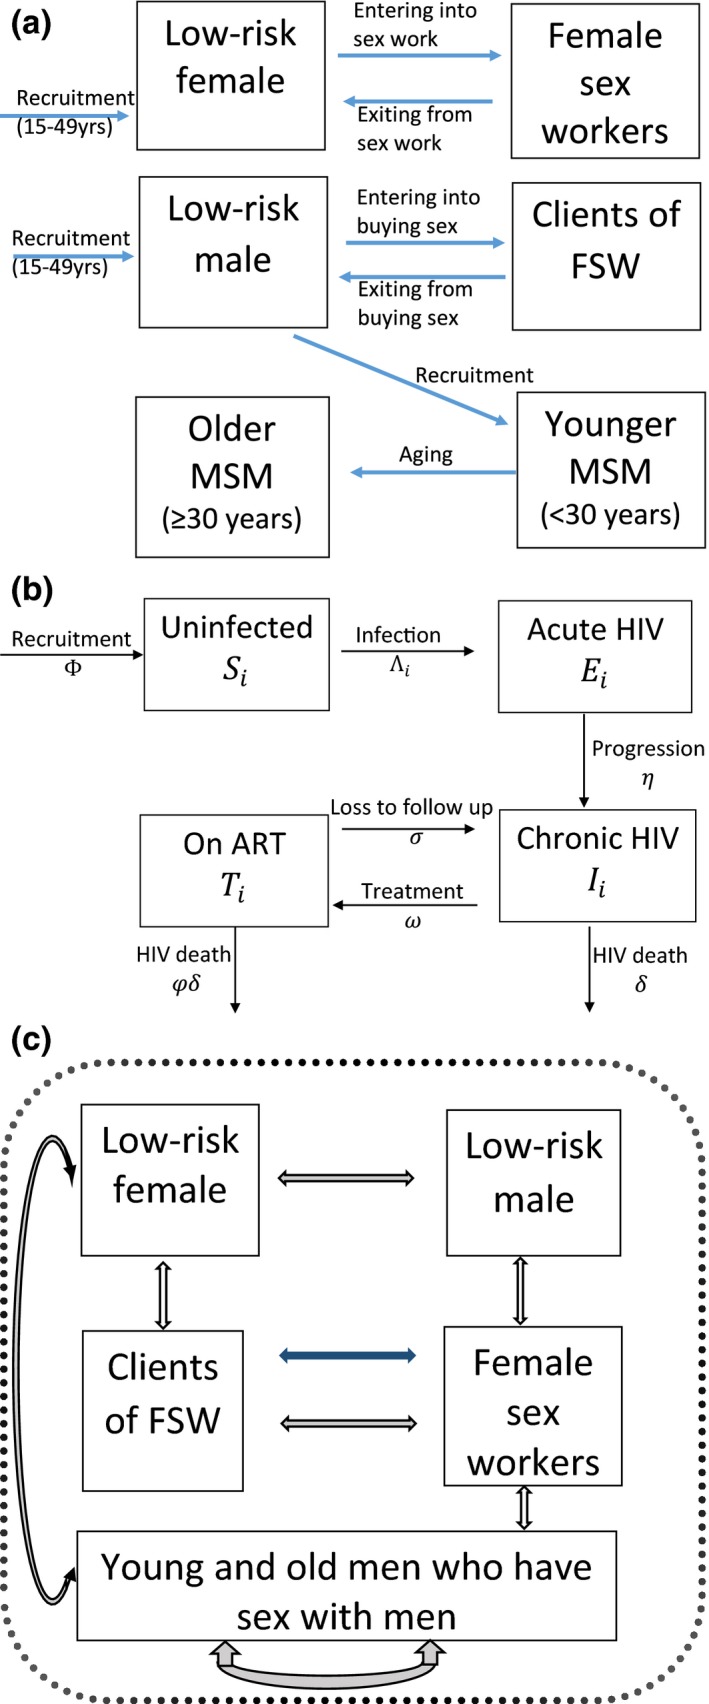
Figure 1.

Model schematic illustrating the (a) movement of individuals in and out of different sub‐populations (male and female low‐risk, clients, female sex workers (FSW), younger and older men who have sex with men (MSM), (b) stratification of the population with respect to HIV infection and (c) sexual interactions which can result in HIV transmission among female, male, FSW, their clients and MSM. Blue arrow in Figure 1c shows commercial sex and all other arrows show sex with main and casual partners.
