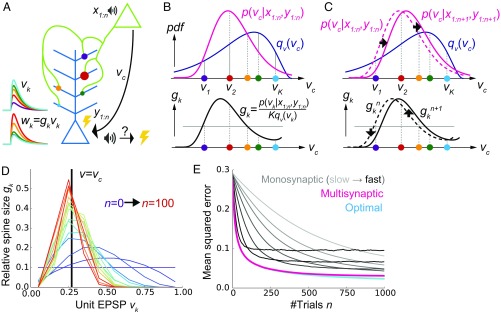
Fig. 1.
A conceptual model of multisynaptic learning. (A) Schematic figure of the model consisting of two neurons connected with K synapses. Curves on the left represent unit EPSP vk (top) and the weighted EPSP wk = gkvk (bottom) of each synaptic connection. Note that synapses are consistently colored throughout Figs. 1 and 2. (B) Schematics of nonparametric representation of the probability distribution by multisynaptic connections. In both graphs, x axes are unit EPSP, and the left (right) side corresponds to distal (proximal) dendrite. The mean over the true distribution p(vc|x1:n,y1:n) can be approximately calculated by taking samples (i.e., synapses) from the unit EPSP distribution qv(v) (Top) and then taking a weighted sum over the spine size factor gk representing the ratio p(vk|x1:n,y1:n)/qv(vk) (Bottom). (C) Illustration of synaptic weight updating. When the distribution p(vc|x1:n+1,y1:n+1) comes to the right side of the original distribution p(vc|x1:n,y1:n), a spine size factor gkn+1 become larger (smaller) than gkn at proximal (distal) synapses. (D) An example of learning dynamics at K = 10 and qv(v) = const. Each curve represents the distribution of relative spine sizes {gk}, and the colors represent the growth of trial number. (E) Comparison of performance among the proposed method, the monosynaptic rule, and the exact solution (see SI Appendix, A Conceptual Model of Multisynaptic Learning for details). The monosynaptic learning rule was implemented with learning rate η = 0.01, 0.015, 0.02, 0.03, 0.05, 0.1, 0.2 (from gray to black), and the initial value was taken as . Lines were calculated by taking average over 104 independent simulations.

