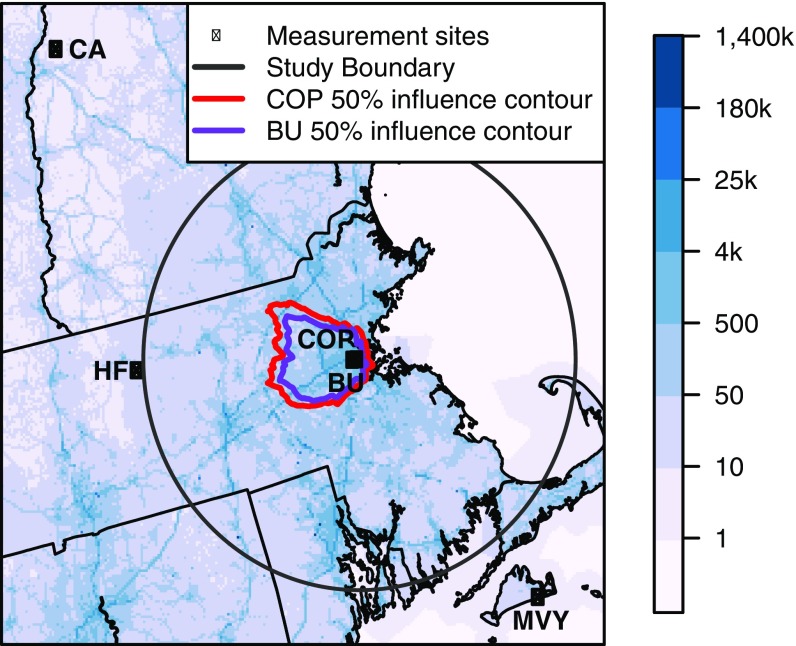
Fig. 1.
Map of measurement stations in the Boston network including two urban sites: BU, 29-m height, and COP, 215-m height; and three boundary sites: HF, CA, and MVY. Blue shading represents 2014 average afternoon CO2 emissions. The 90-km-radius circle bounds the region in which emissions were optimized. The red (purple) contour encloses 50% of the average 2014 footprint (sensitivity area) initiated at the COP (BU) site and including only wind directions within ±40° of the HF or CA boundary sites.

