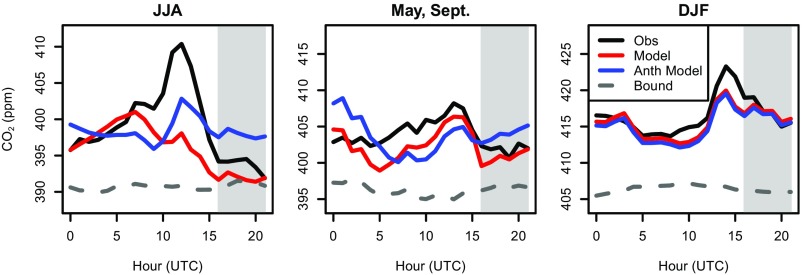
Fig. 5.
CO2 averaged by hour of the day at COP for (Left) June, July, and August; (Center) September and May; and (Right) December, January, and February. Shown are observations (black), unscaled model including anthropogenic and biogenic fluxes (red), anthropogenic fluxes only model (blue), and boundary (dashed black).

