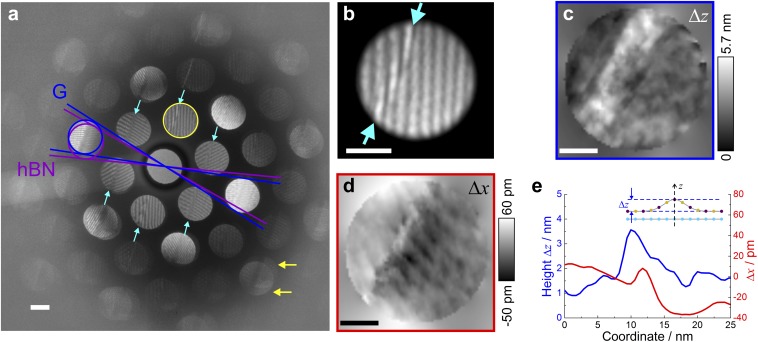
Fig. 5.
Extracting the shape of the out-of-plane ripple from a CBED pattern. (A) Experimental CBED pattern acquired at Δf = −3 μm, with defects in the interference patterns marked by the arrows. The blue and purple lines indicate the relative rotation between graphene and hBN layers, which amounts to 3°. The cyan arrows indicate an out-of-plane ripple observed in the first-order CBED spots. The yellow arrows indicate the separation of CBED spots originating from graphene and hBN layers, where it becomes clear that the ripple is in the hBN layer. The intensity of the central spot is reduced by a factor of 0.1. (Scale bar, 2 nm−1.) (B) Magnified selected spot (circled yellow in A) where irregularities of the fringe pattern can be seen. (Scale bar, 1 nm−1.) (C) The reconstructed distribution of the ripple height Δz. (D) The reconstructed distribution of the lateral shift Δx. (E) Profiles for the magnitude of Δz and Δx profiles perpendicular to the ripple in C and D. (Scale bars in C and D, 10 nm in real space.)

