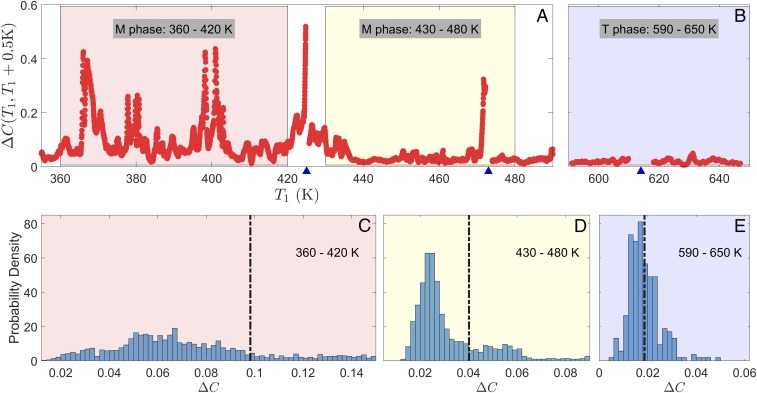
Fig. 4.
Statistics of the correlation decay. (A and B) Plot of the decorrelation decay, ΔC(T1, T1 + 0.5 K) as a function of starting temperature in the monoclinic (M) and tetragonal (T) phases. (C–E) The histograms of the values in A and B, for three selected intervals of T1: 360–420 K, 430–480 K, and 590–650 K. The dashed lines show the sample mean positions. The multimodal character of the histograms in the monoclinic phase is evident. The tick marks on the bottom of A and B show the temperatures at which the sample was realigned.

