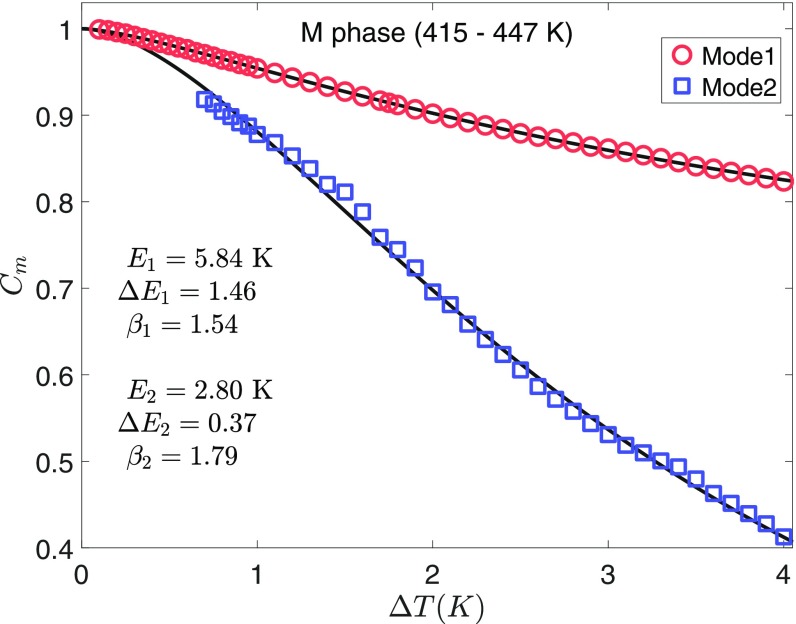
Fig. 8.
The correlation coefficients of the modes in the temperature range of T1 = 415–447 K. Symbols are the results extracted from the fitting of experimental data as explained in the text; solid lines are the fits to Eq. 2 with the best-fit parameters indicated. M, monoclinic.

