Fig. 4.
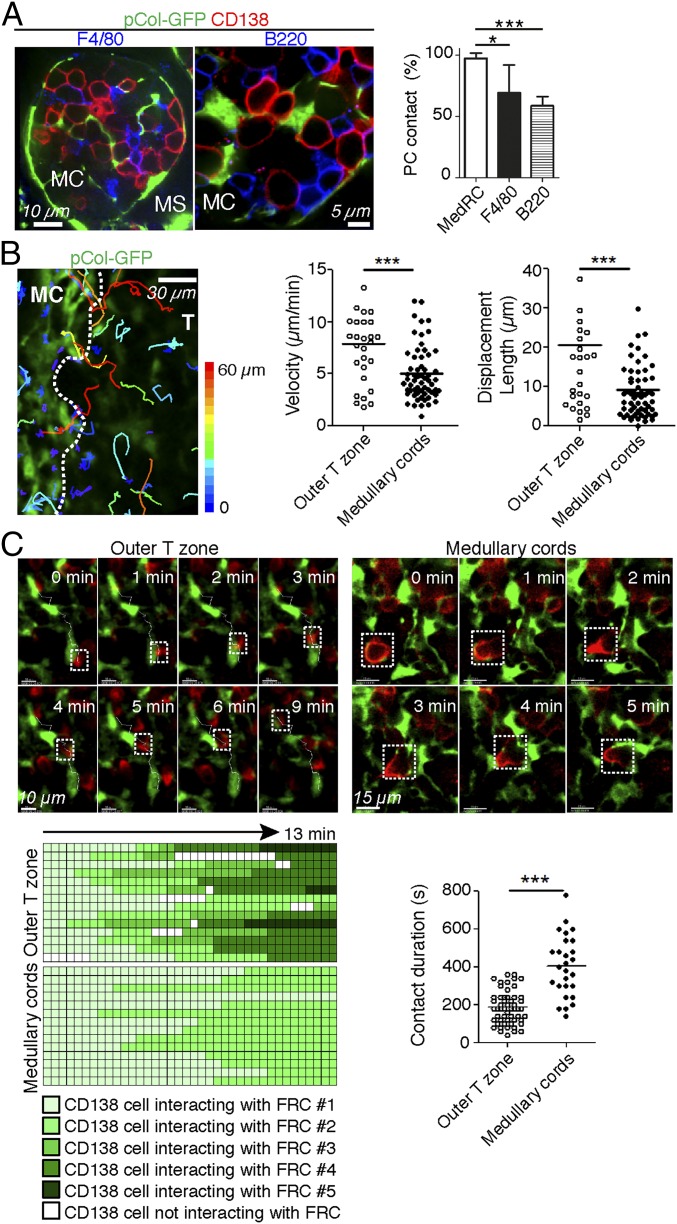
Medullary FRCs are a major component of the plasma cell niche. (A and B) Immunofluorescence images of activated pLNs with MC areas being highlighted. (A) Confocal microscopy of activated pLNs (SRBC d7) from pCol-GFP mice stained with the antibodies indicated. (Right) Frequency of PCs in contact with F4/80+ and B220+ cells. Values are mean ± SD of three to five experiments in which conjugates were scored from six to nine LN slices. (B and C) Localization and migration of endogenous PBs/PCs in vibratome sections of viable activated pLNs from pCol-GFP mice. (B) Tracks of individual endogenous PBs/PCs in relation to GFP+ FRCs. Tracks are color coded according to the extent of PB/PC displacement. Graphs at Right show velocities and displacement lengths of PBs/PCs. Values are from three experiments in which cells were monitored from three to five LN slices. See also Movie S3. (C) Motile behavior of PBs/PCs relative to GFP+ FRCs. (Top) Snapshots are shown at various time intervals for the same zone and cells. The trajectory of PBs/PCs in the outer T zone was superimposed over fluorescence images. See also Movies S4 and S5. (Bottom Left) Graphic representation of interactions between PBs/PCs and GFP+ FRCs. Each row corresponds to an individual PB/PC, and the periods of contact with FRCs are colored with different shades of green corresponding to different FRC partners and white corresponding to no FRC partner being visible. Graph at Bottom Right summarizes the average contact time of PBs/PCs with their FRC partners. *P < 0.05, ***P < 0.001.

