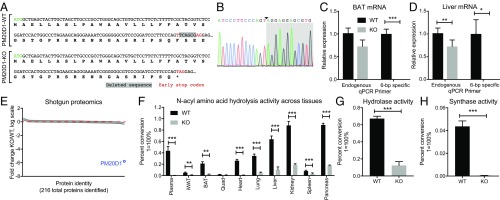
Fig. 1.
Generation of the PM20D1-KO mouse and loss of NAA hydrolase/synthase activity in PM20D1-KO tissues. (A) Nucleotide and predicted protein sequence for the Pm20d1 gene from WT or PM20D1-KO animals. The ∆6-bp out-of-frame deletion is highlighted in gray, and the newly generated early stop codon is identified by red text. (B) Sanger sequencing chromatograms of a PCR product amplified from the Pm20d1 gene in PM20D1-KO mice. The new A–T junction is identified by the arrowhead, and the 25-bp region flanking this junction is shown. (C and D) Relative levels of Pm20d1 mRNA from BAT (C) and livers (D) of WT and PM20D1-KO mice using qPCR primers that anneal either downstream of the ∆6-bp deletion (“endogenous”) or directly on the deleted wild-type sequence (“6-bp specific”). (E) Fold change in protein abundance of 216 proteins detected by quantitative shotgun proteomics from livers of WT and PM20D1-KO mice. The red dashed line indicates a fold change = 1 in KO versus WT mice. (F) Percent conversion of the starting material C20:4-Gly into an arachidonic acid product in the indicated tissues from WT or PM20D1-KO mice. (G) Percent conversion of the C18:1-Phe starting material into an oleate product in livers from WT and PM20D1-KO mice. Hydrolase reactions in F and G were performed by incubating 100 µg of whole-tissue lysate in 100 µL PBS with 100 µM of the indicated NAA for 1 h at 37 °C. (H) Percent conversion of the Phe starting materials into a C18:1-Phe product in livers from WT and PM20D1-KO mice. Synthase reactions were performed by incubating 100 µg of whole-liver lysate in 100 µL PBS with 100 µM Phe and 2 mM oleic acid for 1 h at 37 °C. Data are shown as means ± SEM; *P < 0.05, **P < 0.01, ***P < 0.001 for the indicated comparisons. For C, D, and F–H, n = 4 per group. For E, n = 2 per group.

