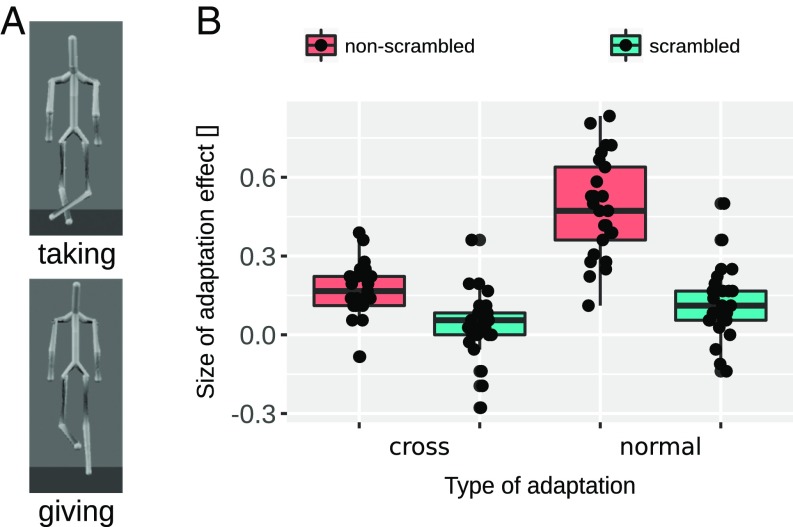
Fig. 3.
(A) Peak frames of the two adaptors used in experiment 2. (Top) Scrambled taking adaptor. (Bottom) Scrambled giving adaptor. (B) Results of experiment 2. Boxplots of the adaptation aftereffect for cross- and normal adaptation conditions are shown for each scrambling condition separately (different colors). Boxes indicate the IQR with the midline in the box being the median. Whiskers mark intervals of 1.5 times the IQR ranges. Dots show individual data.

