
Fig. 1. PAF1 regulates transcriptional activity of enhancers.
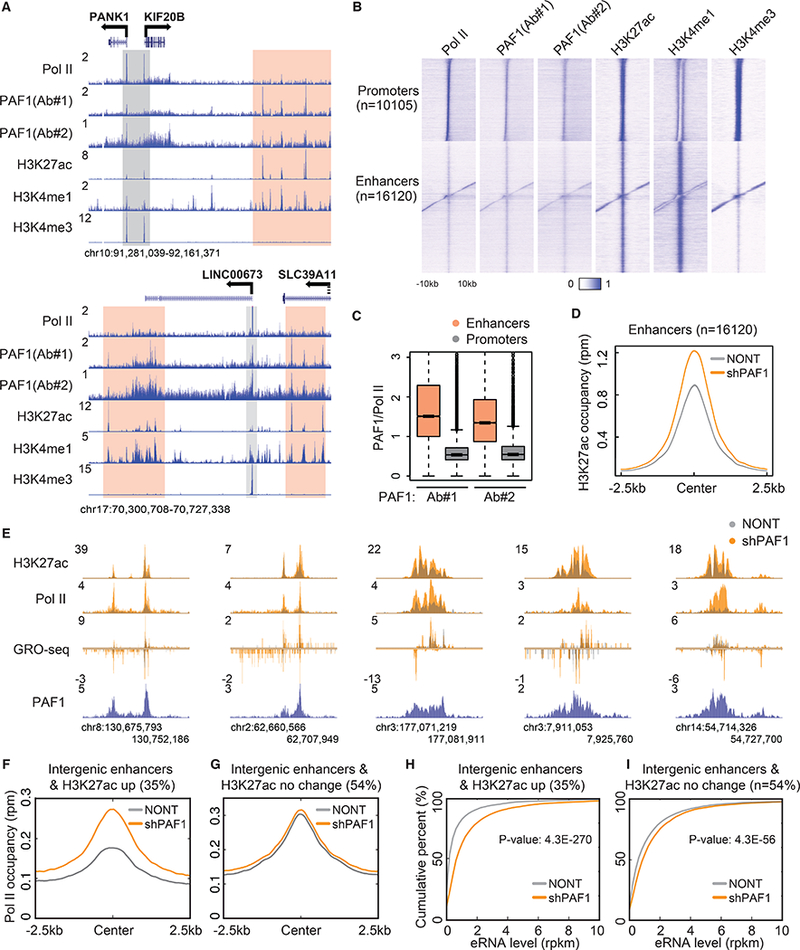
(A) Representative genome browser track examples of Pol II, PAF1, H3K27ac, H3K4me1 and H3K4me3 ChIP-seq in HCT116 cells. The y-axis represents normalized read density in reads per million (rpm). Gray and peach boxes indicate the promoter and putative enhancer regions, respectively. (B) Heatmaps of the occupancy of Pol II, PAF1, H3K27ac, H3K4me1 and H3K4me3 at active promoters and enhancers. Color-scaled intensities are in units of rpm. (C) Boxplots showing the ratio of PAF1 to Pol II occupancy at promoters and enhancers. P-value < 2.2e-16. (D) Metaplots of H3K27ac occupancy in cells transduced with non-targeting (NONT) or PAF1 shRNA (shPAF1) at enhancers. (E) Genome browser track examples at the loci of activated enhancers following PAF1 depletion. (F and G) Metagene analysis of Pol II occupancy at intergenic enhancers with increased H3K27ac (F) and with no significant change of H3K27ac (G) by PAF1 knockdown. (H and I) Empirical cumulative distribution function (ECDF) plots measuring eRNA levels at intergenic enhancers with increased H3K27ac (H) and with no significant change of H3K27ac (I) by PAF1 knockdown. P-value was calculated by the Kolmogorov–Smirnov (KS) test.