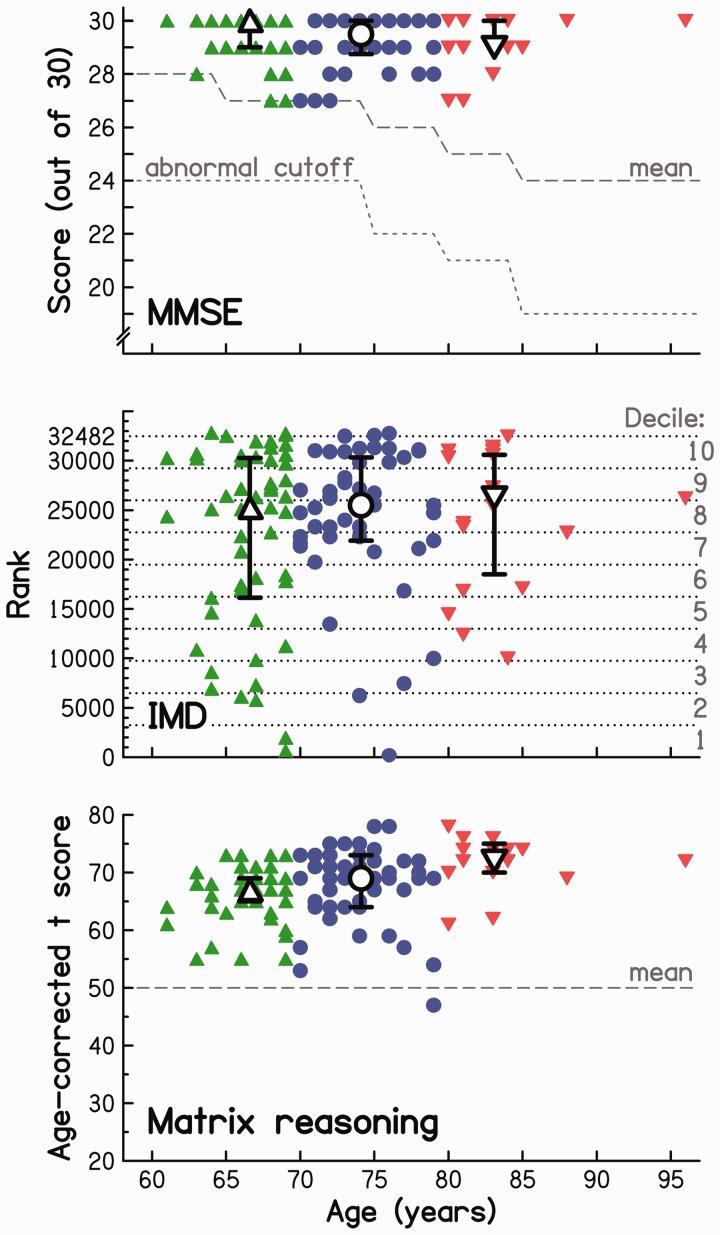
Figure 2.
Individual (colored symbols) and age-group median (open symbols) cognitive and sociodemographic data as a function of participant age. Error bars represent the interquartile range. Top panel: MMSE scores along with reference mean data (Crum et al., 1993) and abnormal cutoff (Iverson, 1998) for a sample of 18,056 participants. Middle panel: IMD ranks; corresponding deprivation deciles are given on the right. Bottom panel: Age-corrected t scores (M = 50; SD = 10) for nonverbal fluid reasoning as measured by the Matrix Reasoning test. MMSE = Mini Mental State Examination; IMD = Index of Multiple Deprivation.

