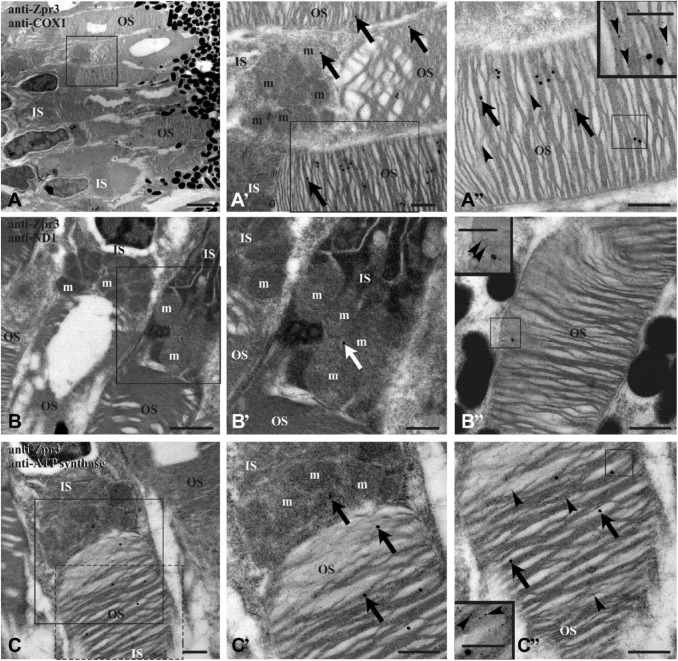
Figure 4.
TEM on retina of embryo (4 dpf) zebrafish. Zebrafish retina double labeled with antibodies anti-zpr3 (small, 5 nm-width gold particles; arrowheads) and anti-COX1 (A–A″), anti-ND1 (B–B″), and anti-subunit of ATP synthase (C–C″), respectively (large, 25 nm-width gold particles; arrows). Squared area in A is enlarged in A′, whereas squared area in A′ is enlarged in A″. Squared area in B is represented in B′. Squared area in C is enlarged in C′; dotted d area in C is represented in C″. Controls were performed by omitting primary Ab, which resulted in absence of cross-reactivity (see Supplementary Fig. 3). Scale bar = 2 µm in Panel A, 1 µm in Panel B, and 500 nm in Panels A′, A″, B′, B″, C, C′, and C″. In the inset of Panels A″, B″, and C″, scale bar = 250 nm. Abbreviations: TEM, Transmission Electron Microscopy; dpf, days postfertilization; ATP synthase, FoF1-ATP synthase; IS, rod inner segment; m, mitochondrion; OS, rod outer segment.

