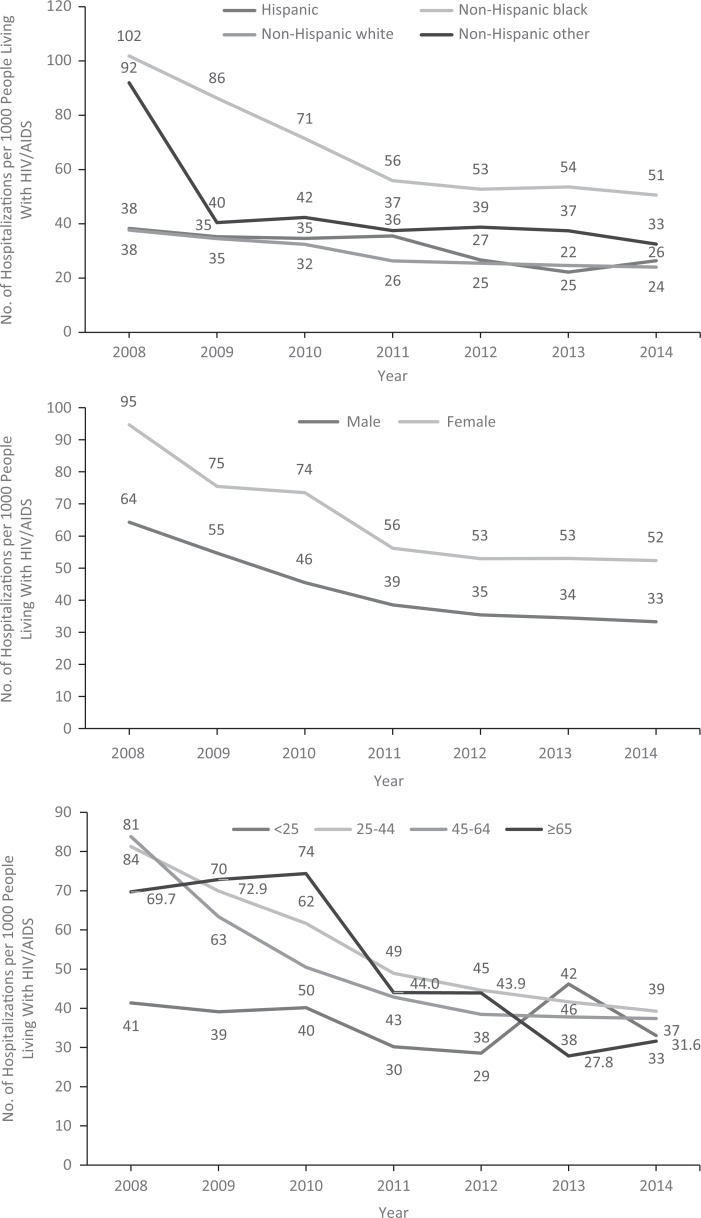
Figure 2.
Rates for principal hospitalizations (n = 10 980) among people living with HIV/AIDS, by race/ethnicity, sex, age group, and year, Illinois, 2008-2014. Excluded were 332 hospitalizations for which the patient’s ZIP code indicated the patient did not reside in Illinois. Data sources: Illinois Department of Public Health hospital discharge data10; Illinois HIV surveillance data13; and US Census population estimates, 2008-2014.14

