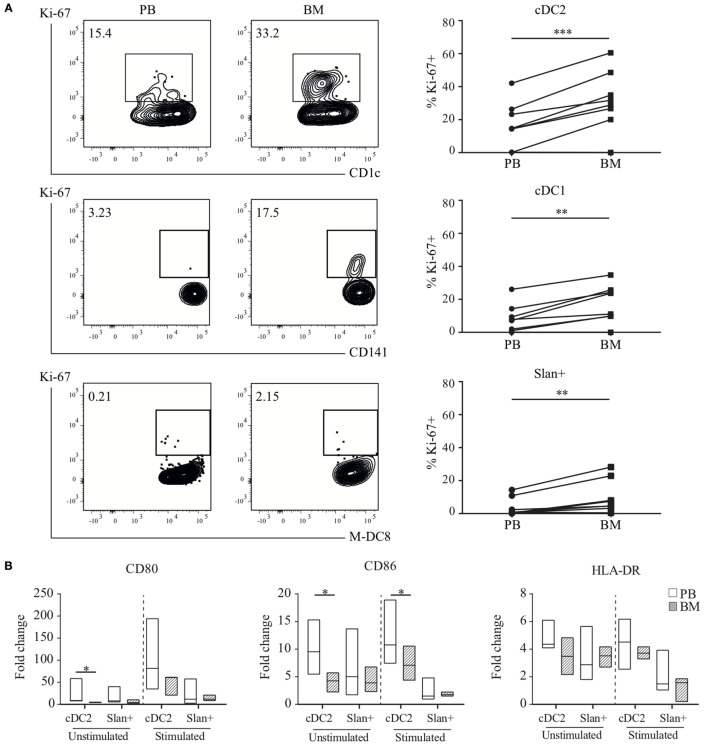
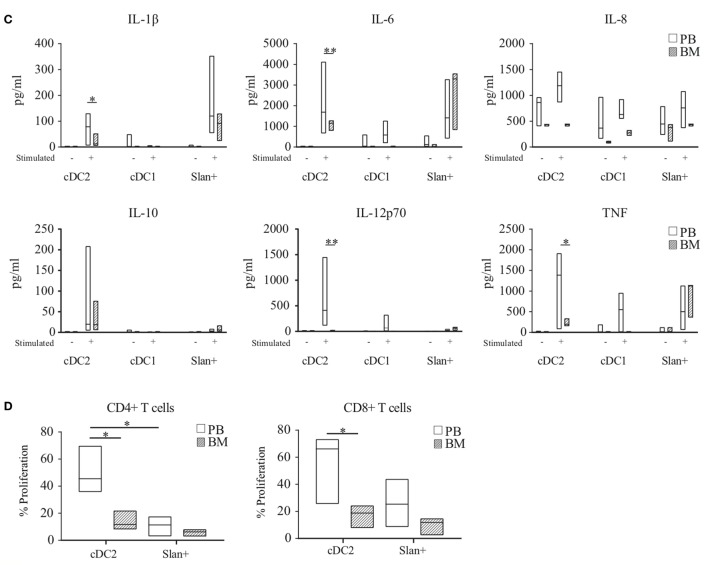
Figure 6.
Functional validation of transcriptional findings in myeloid DC and slan+ non-classical monocytes. (A) Ki-67 expression in peripheral blood (PB) and bone marrow (BM) subsets. A representative plot of one donor and percentages of positive cells of eight matched samples are shown. A Wilcoxon matched-pairs signed rank test was used to compare the compartments. (B) Maturation capacity upon TLR-stimulation. Isolated PB or BM cDC2 and slan+ monocytes were either left unstimulated or were stimulated overnight with LPS + R848. Expression levels of CD80, CD86, and HLA-DR were assessed by flow cytometry. The fold change (FC) in median fluorescence intensity (MFI) values at baseline and after overnight culture (unstimulated or stimulated condition) was calculated. Median FC values for 6–10 PB and 3–4 BM (cDC2) or 8–12 PB and 3–4 BM (slan+) experiments are shown. (C) Cytokine secretion assay. Culture supernatants of PB-derived cDC1 (n = 3), cDC2, and slan+ (n = 6) cells and BM-derived cDC1 (n = 2), cDC2, and slan+ (n = 4) cells, unstimulated and stimulated (cDC2 and slan+: LPS + R848, cDC1: Poly I:C + R848), were analyzed for the presence of different cytokines by cytometric bead array (CBA, pg, picogram). (D) Allogeneic mixed leukocyte reaction (MLR). CFSE-labeled peripheral blood lymphocytes (PBL) were co-cultured with PB or BM-derived cDC2 or slan+ monocytes. The percentage of CFSE-diluted T cells was determined by using flow cytometry. Median values of four different experiments are shown. *p < 0.05, **p < 0.01, and ***p < 0.001.


