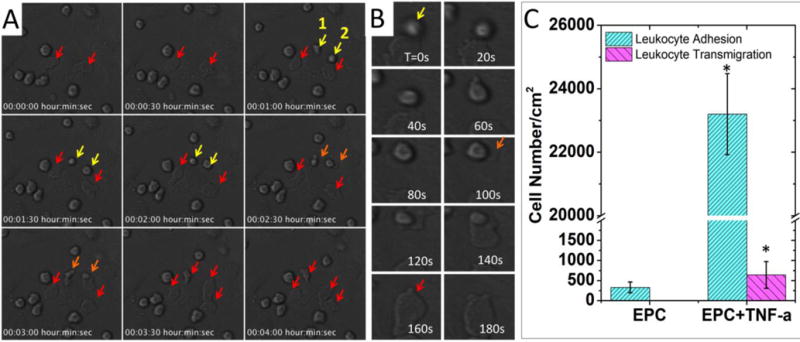
Figure 4.

Imaging of monocyte adhesion and transmigration on 2D-cultured endothelial cells. (A) Time-lapse imaging of monocyte-like HL-60 cells attached to TNF-α-activated endothelial progenitor cells (EPC). Arrows indicate monocytes attached to ECs. Yellow arrow: attached monocytes. Orange arrow: monocytes undergoing transendothelial migration. Red arrow: monocytes after transendothelial migration. Cell morphologies changed after transmigration, as they were squeezed and trapped between ECs and the substrate. (B) A montage of monocytes undergoing trans-endothelial migration. The transmigration event happened during 100s-160s. (C) Comparison of the monocytes interaction with EPCs with or without TNF-α treatment. Adhesion: control (330±133/cm2) vs. TNF-α (23200±1276/cm2); transmigration: control (not observed) vs. TNF-α (640±332/cm2). In each experiment, the cell number was counted and averaged from 3 microscopic views. Data are shown as mean ± SEM from four independent experiments. Significance was determined by student t-test; * p<0.05.
