
Figure 2. Percentage of unintended pregnancies that end in abortion, by geographical area and time period.
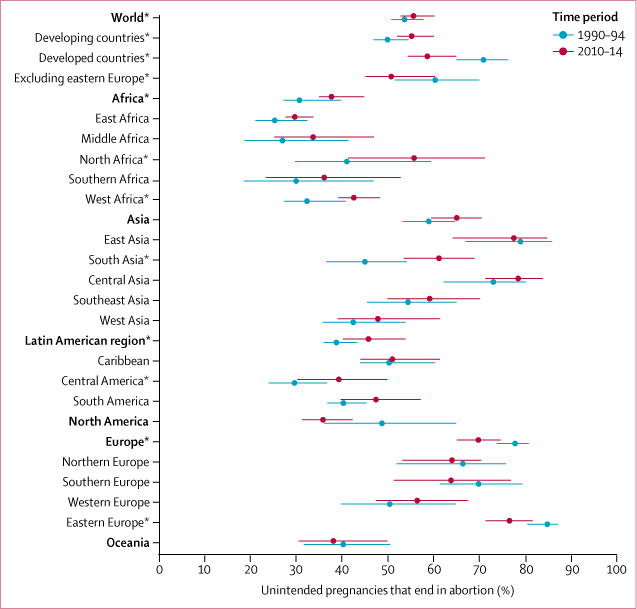
Horizontal lines are 90% uncertainty intervals. *Posterior probability of change between 1990–94 and 2010–14 in the estimated direction is greater than 95%.