Figure 2.

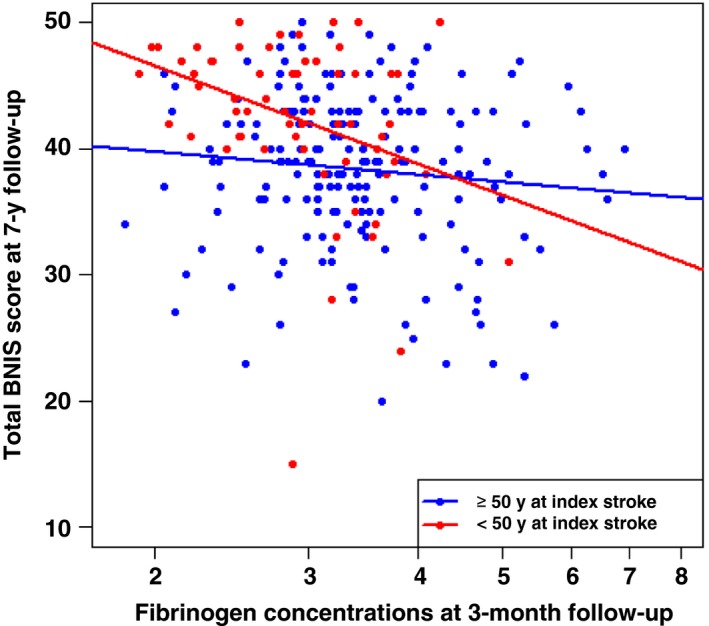
Scatterplot with regression lines for plasma concentrations of fibrinogen at baseline in relation to total BNIS score at 7‐year follow‐up. BNIS, Barrow Neurological Institute Screen for Higher Cerebral Functions

Scatterplot with regression lines for plasma concentrations of fibrinogen at baseline in relation to total BNIS score at 7‐year follow‐up. BNIS, Barrow Neurological Institute Screen for Higher Cerebral Functions