Fig. 1.

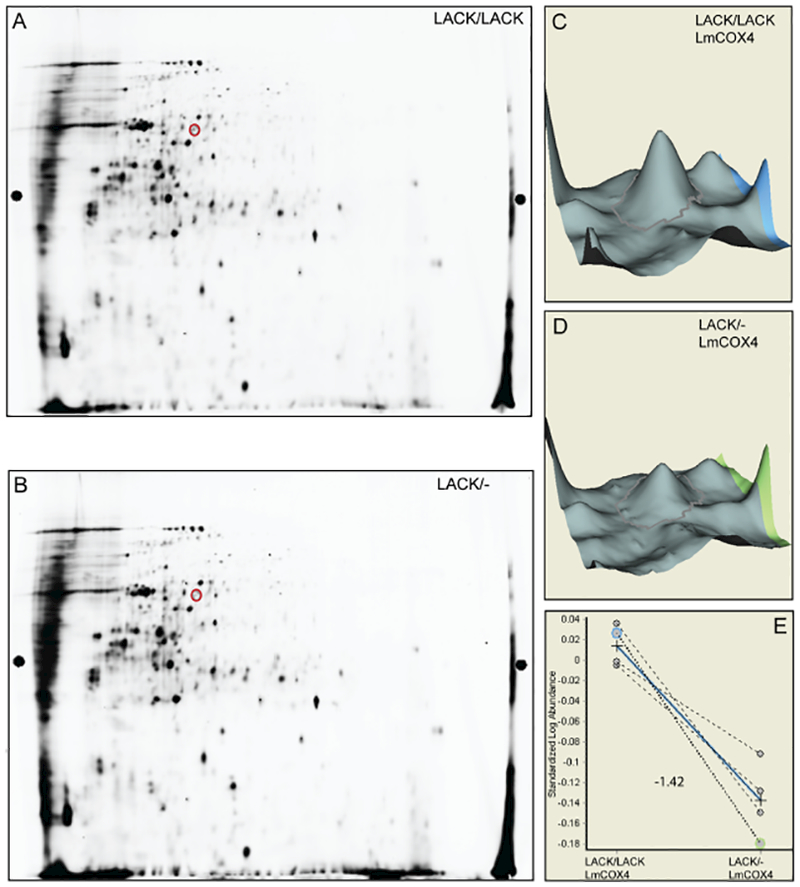
Cytochrome c oxidase subunit LmCOX4 is decreased in LACK/− L. major at 35°C.
A and B. 2D-DIGE gels of LACK/LACK and LACK/− L. major lysates, respectively, obtained from parasites cultured at 35°C for 4 days (representative of four separate replicates). Red circles denote LmCOX4 as determined by mass spectrometry.
C and D. 3-dimensional representation of the volume of the LmCOX4 spots from parts A and B, respectively, using the DeCyder Biological Variation Analysis (BVA) module. </p/>E. Differences in the LmCOX4 spot abundance, across four independent experiments, between LACK/LACK and LACK/− parasites. The blue line indicates the average difference in abundance, and the number indicates the fold change in abundance of LACK/− to LACK/LACK.
