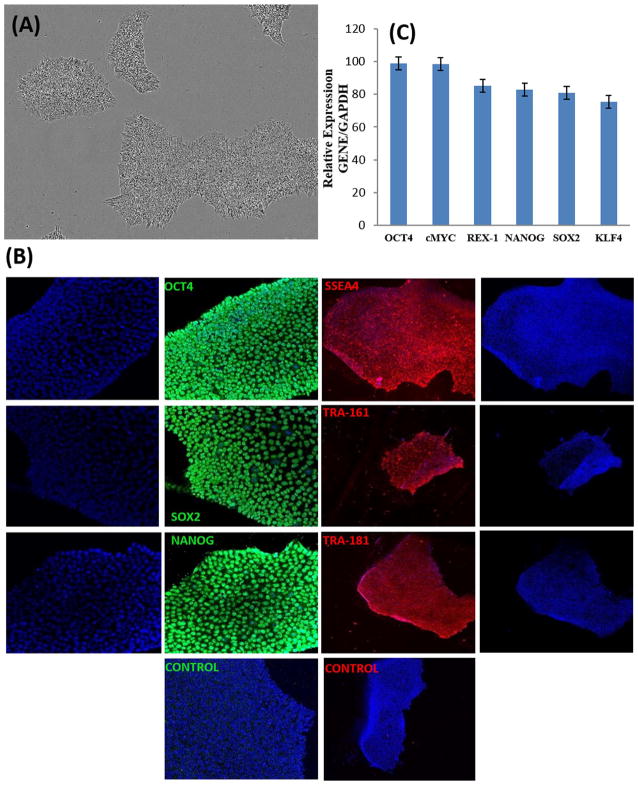
Fig. 1. Characterization of human iPSCs.
(A) Phase Contrast Micrograph of human iPSC colonies (20 ×). (B) Immunostaining of human iPSC clones for pluripotency markers OCT4, SOX2, NANOG, SSEA-4, Tra-1–60, and Tra-1–81. Nuclei were stained with DAPI in all. (C) qRT-PCR analysis for relative expression of OCT-4, cMYC, REX-4, NANOG, SOX-2 and KLF4. Columns show the combined mean ΔΔCq values for each marker. Data represent relative expression of transcripts normalized relative to GAPDH and expressed at the Mean ± SEM. Representative data from three independent experiments are shown.

