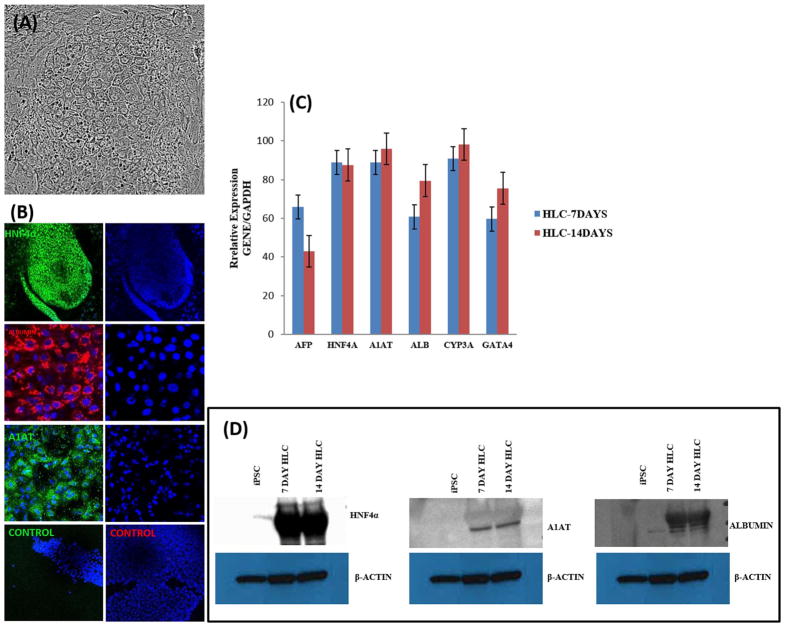
Fig. 4.
Characterization of Hepatocyte-like cell differentiation. (A) Representative phase contrast micrograph of HLC cells (20 ×). (B) Expression of HNF4A, A1AT and ALBUMIN at 7 and 14 days, imaged with confocal microscopy. (C) Relative gene expression after 7 and 14 days of differentiation as measured by qRT-PCR. Data represent relative expression of transcripts normalized relative to GAPDH and undifferentiated controls. Data are represented as Mean ± SEM for three biologically independent experiments (n = 3). (D) Western blot assessment of HNF4A, A1AT and ALBUMIN expression at 7 and 14 days of HLC maturation. Representative data from three independent experiments are shown.

