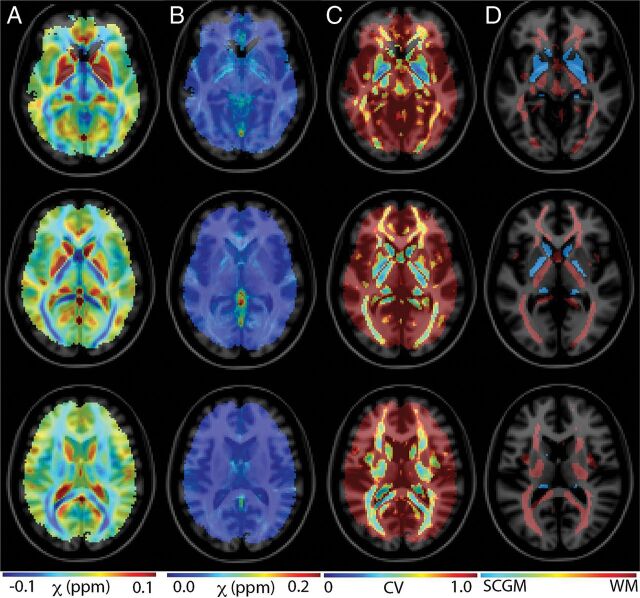
Fig 1.
Assessment of QSM stability across the control group. Maps of mean (A), SD (B), and coefficients of variation (C) are shown across 4 axial slices throughout the brain. The stability of the QSM measurement varies across brain compartments. Deep gray and white matter structures show the most prominent stability. D, Subcortical gray matter (blue) and white matter (red) regions that were identified on MNI atlases and masked to reflect regions of sufficient susceptibility measurement stability (CV < 0.8).

