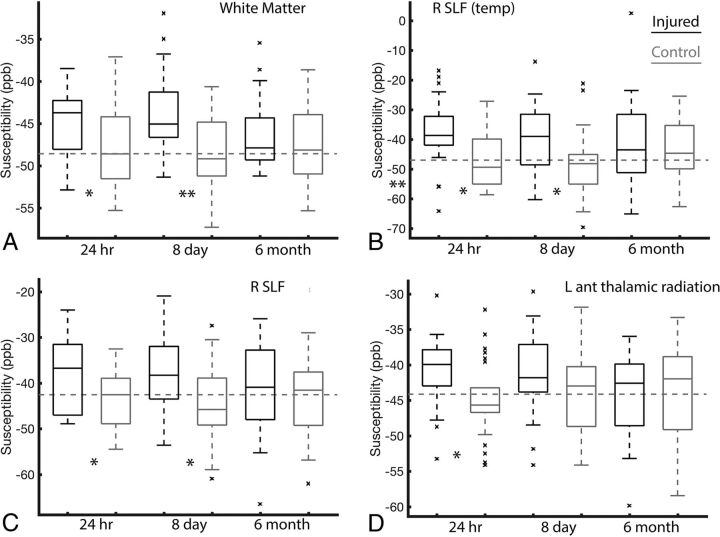
Fig 2.
Boxplots of susceptibility means across 4 representative white matter regions. Indices for each region, as defined in Table 1, are provided for each boxplot. The displayed boxplots provide median lines, boxes across the interquartile range, and bars across the 95th confidence interval regions. Outliers are plotted as x's. The dashed horizontal line provides a visual of the full control cohort mean susceptibility value. Statistical significance of the injured-versus-control t tests at each visit are indicated for P < .05 (asterisk) and P < .01 (double asterisks). SLF indicates superior longitudinal fasciculus; ant, anterior; temp, temporal; L, left; R, right.

