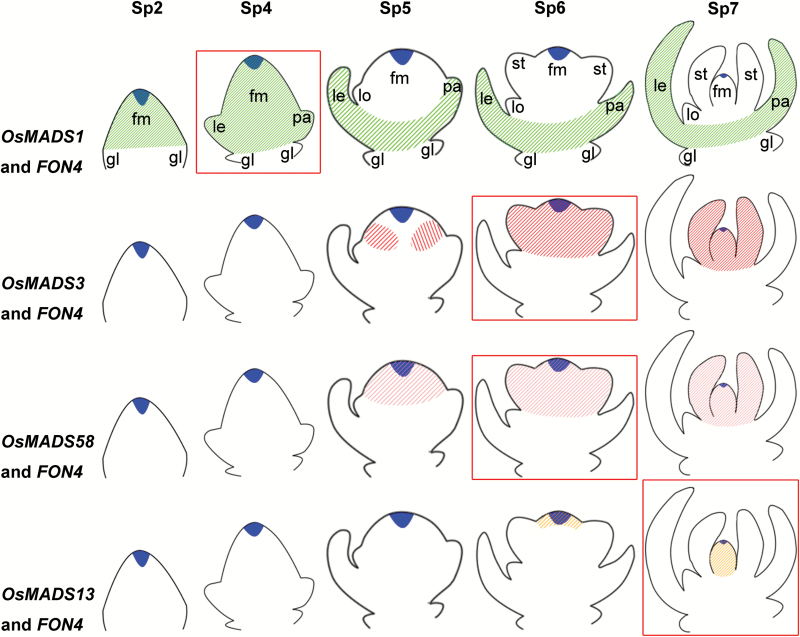
Fig. 7.
Comparison of the expression pattern of FON4 and floral homeotic genes from stage Sp2 to Sp7. Blue indicates the expression region of FON4, and the green, red, pink, and orange oblique lines indicate the expression region of OsMADS1, OsMADS3, OsMADS58, and OsMADS13, respectively. At the stages (red square) when apparent abnormalities are observed in the double mutants, the expression region of FON4 partially overlaps with these genes in the floral meristem. fm, floral meristem; gl, glume; le, lemma; lo, lodicule; pa, palea; st, stamen.

