
Fig. 2.
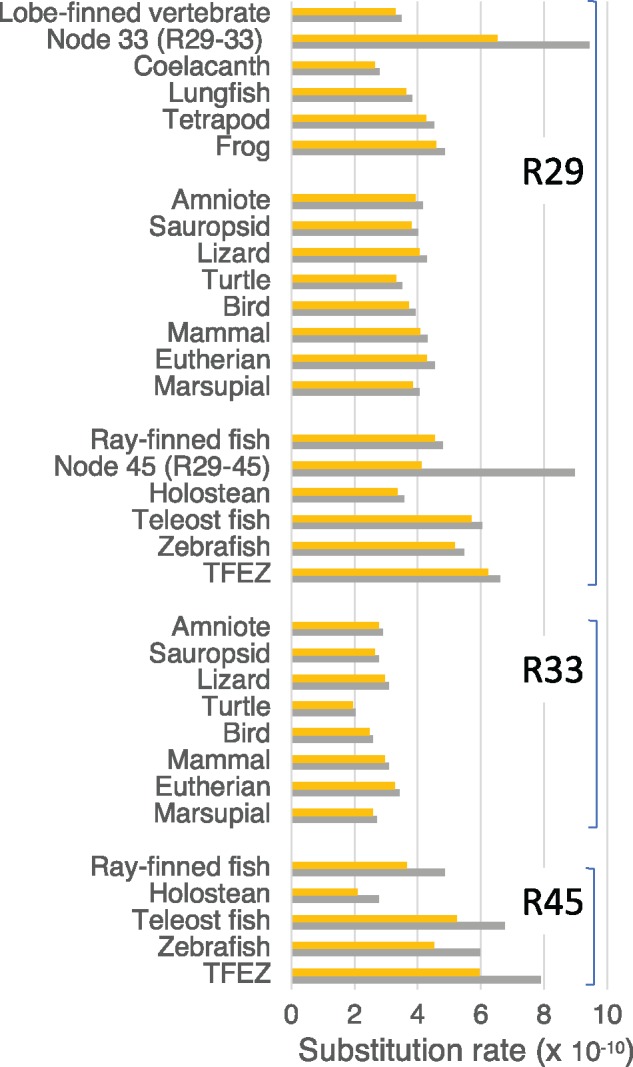
—The substitution rates estimated by setting nodes 29, 33, 45 (N29, N33, N45) as calibration points (R29, R33, R45). Orange bars and gray bars indicate rates assuming minimum and maximum ages for the nodes, respectively. TFEZ: teleost fish excluding zebrafish. Holostean: gar and bowfin.