
Fig. 5.
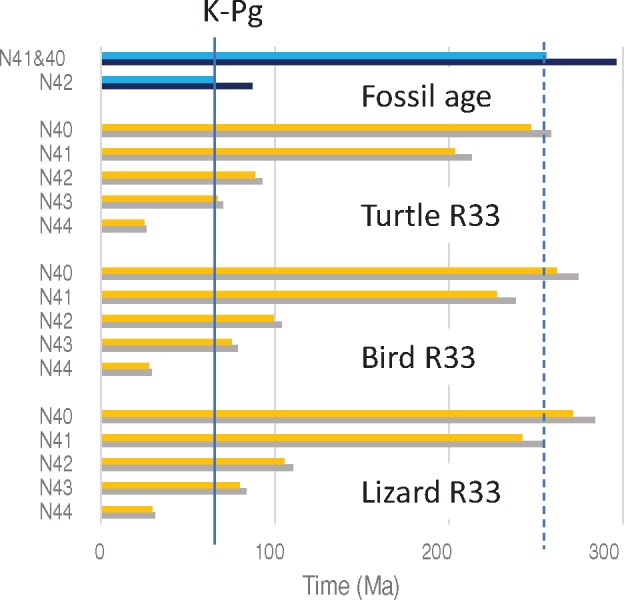
—The fossil ages and estimated times within sauropsids by setting N33 as a calibration point. Blue and black bars indicate minimum and maximum ages of fossil ages, respectively. Orange and gray bars indicate estimated times using the minimum and maximum fossil ages of N33 as calibration points. The solid vertical line indicates K–Pg boundary (66 Ma). The dotted vertical line indicates the minimum fossil age of N40 and N41.