
Fig. 6.
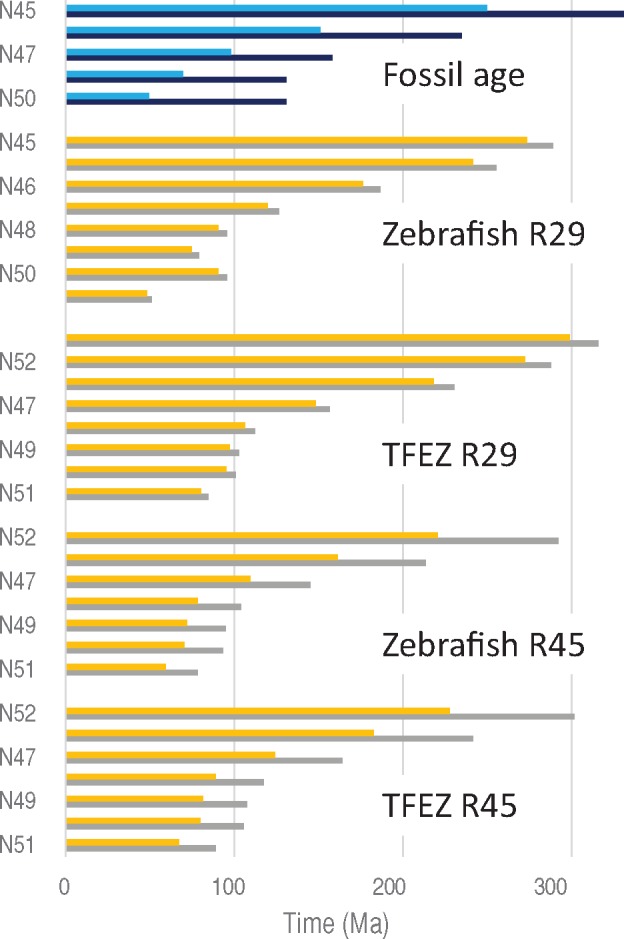
—The fossil ages and estimated times in ray-finned fish by setting N29 and N45 as calibration points. Blue and black bars indicate minimum and maximum ages of fossil ages, respectively. Orange and gray bars indicate estimated times.
Official websites use .gov
A
.gov website belongs to an official
government organization in the United States.
Secure .gov websites use HTTPS
A lock (
) or https:// means you've safely
connected to the .gov website. Share sensitive
information only on official, secure websites.
—The fossil ages and estimated times in ray-finned fish by setting N29 and N45 as calibration points. Blue and black bars indicate minimum and maximum ages of fossil ages, respectively. Orange and gray bars indicate estimated times.