
Figure 1.
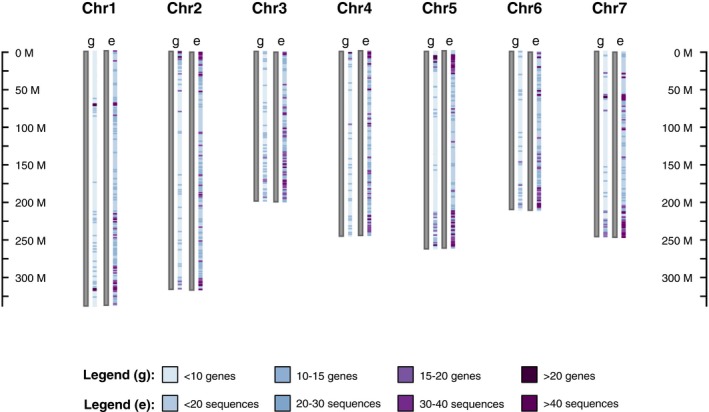
The distribution of genes (g) and the exome‐capture sequences (e) across the Lens culinaris (cv. CDC Redberry) genome. The scale shows the length (base pairs) of each chromosome, and the color‐coded legend shows the density of genes and exome‐capture sequences in each chromosome.