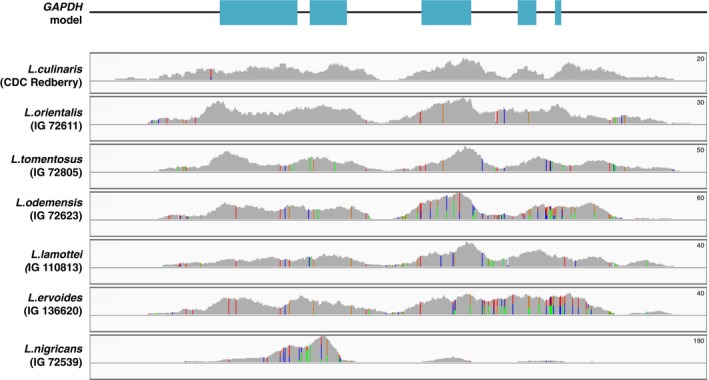
Figure 2.

Exome coverage of GAPDH in Lens. GAPDH model shows the exons (cyan rectangles) and noncoding regions (black line). All sizes are proportional to the actual length of the genic region. Below the gene model are the exome coverage plots for seven Lens species. The peak sizes are proportional to the read depth, colored lines represent variant loci, and each color corresponds to a different allele. The maximum read depth is shown on the top right of each panel.
