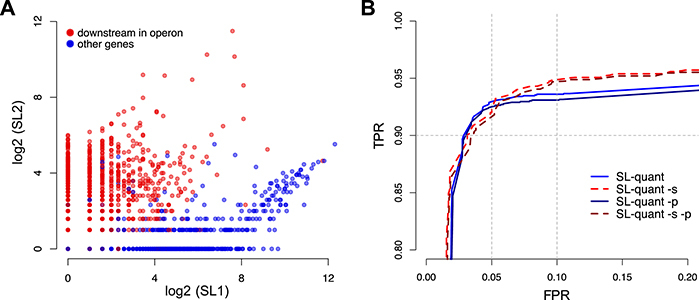
Figure 4:

Prediction of gene position in operons. (A) Number of SL1 and SL2 trans-splicing events by genes as calculated using SL-quant. Genes annotated as downstream in the operons are represented as red dots. (B) Receiver operating characteristic curve analysis using the SL2/(SL1 + SL2) ratio as a predictor of downstream position in operons for the 5,521 genes with at least one trans-splicing event detected. The number of SL1 and SL2 trans-splicing events by genes was calculated using SL-quant in single or paired (-p) mode, with or without the sensitive (-s) option. TPR: true-positive rate, FPR: false-positive rate.
