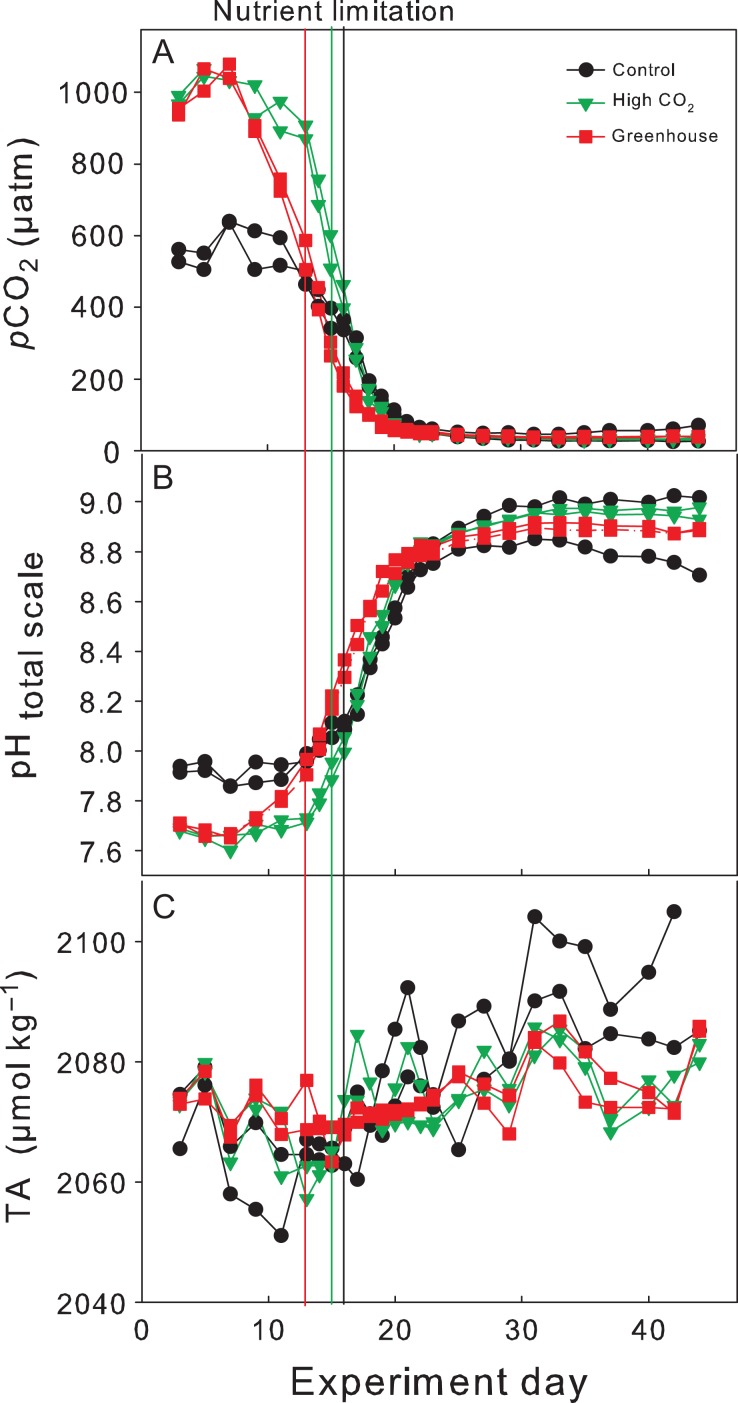
Fig. 1.
Development of (A) CO2 partial pressure (pCO2), (B) pHtotalscale and (C) TA during the experiment. pCO2 and pH were calculated from measured TA and DIC (see Methods for details). Vertical lines indicate time of nitrate depletion; red line corresponds to Greenhouse treatment, green line to High CO2 treatment and the black line to the Control.

