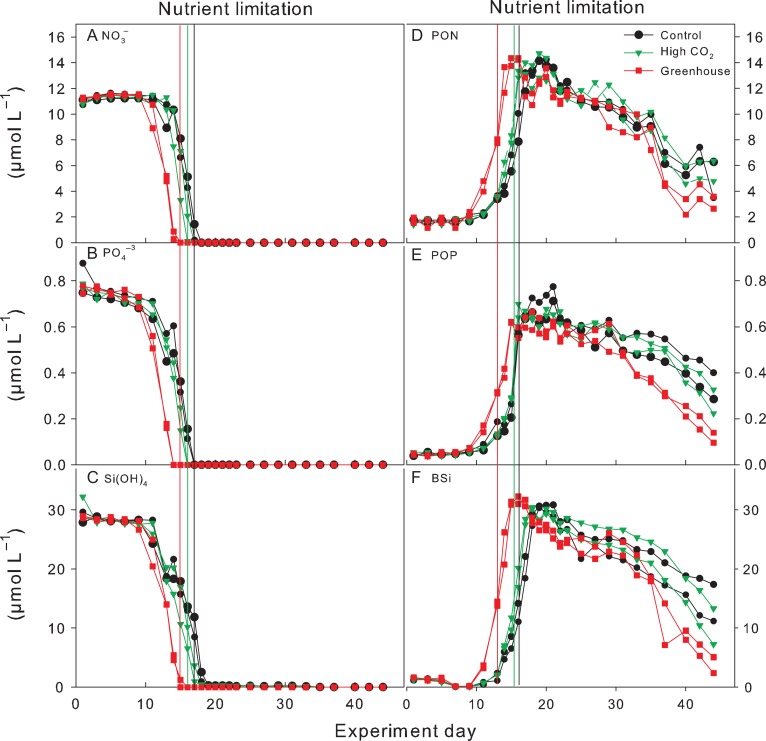
Fig. 2.
Development of major dissolved inorganic nutrients and POM concentrations during the experiment. (A) nitrate, (B) phosphate, (C) silicate, (D) particulate organic nitrogen, (E) particulate organic phosphorus and (F) biogenic silica. Vertical lines indicate time of nitrate depletion; red line corresponds to Greenhouse treatment, green line to High CO2 treatment and black to Control.

