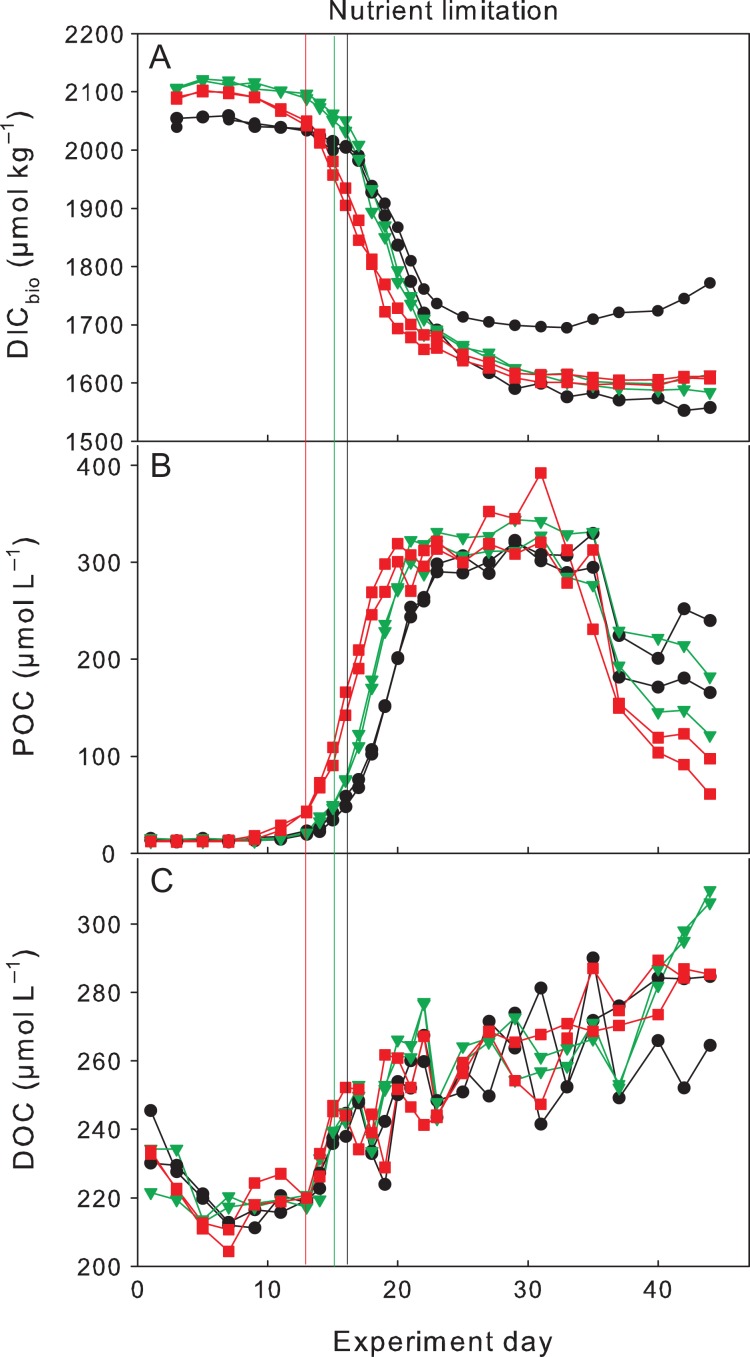
Fig. 4.
Carbon dynamics during the experiment for (A) DIC (corrected for gas exchange), (B) particulate organic carbon and (C) DOC. Colour coding according to Fig. 1. Vertical lines indicate time of nitrate depletion; red line corresponds to Greenhouse treatment, green line to High CO2 treatment and black to Control. Please note that concentrations of one of the Controls deviate from its duplicate after the bloom peak due to a defective lid (see section Carbon cycling in the Results section for details).

