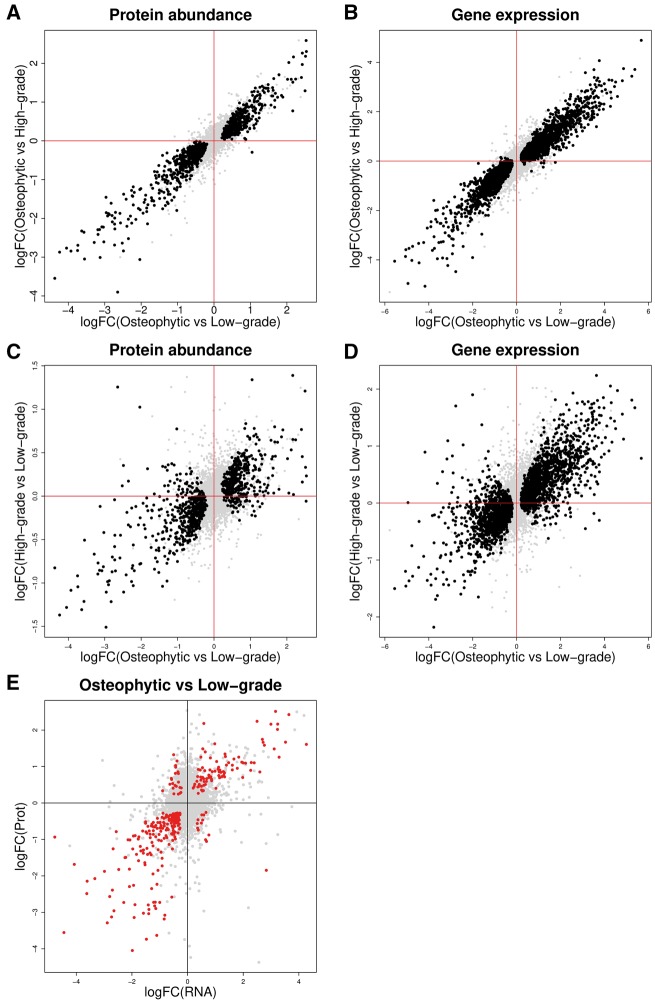
Fig. 1.
Gene expression and protein abundance differences between osteophytic chondrocytes, low-grade, and high-grade articular chondrocytes
(A and B) Differences between osteophytic and low-grade articular chondrocytes are correlated with differences between osteophytic and high-grade articular chondrocytes for protein abundance (A) and gene expression (B). (C and D) Differences between osteophytic and low-grade articular chondrocytes are correlated with differences between high- and low-grade articular chondrocytes for protein abundance (C) and gene expression (D). (E) Differences in gene expression and protein abundance identified between osteophytic and low-grade articular chondrocytes are correlated. Each point represents one gene. Black: genes with significant changes between osteophytic and low-grade articular cartilage at 0.1% FDR. Red: genes with significant changes on both protein and RNA level between osteophytic and low-grade articular chondrocytes at 0.1% FDR.

