Figure 5.

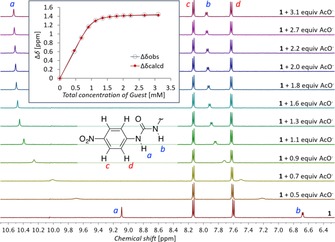
Downfield region of the 1H NMR spectra from the titration of receptor 1 (1 mm) with Bu4N+OAc− in [D6]DMSO with 0.5 % H2O. The inset shows the observed binding curve for NHa (blue) and the calculated fit for both NH signals (red).

Downfield region of the 1H NMR spectra from the titration of receptor 1 (1 mm) with Bu4N+OAc− in [D6]DMSO with 0.5 % H2O. The inset shows the observed binding curve for NHa (blue) and the calculated fit for both NH signals (red).