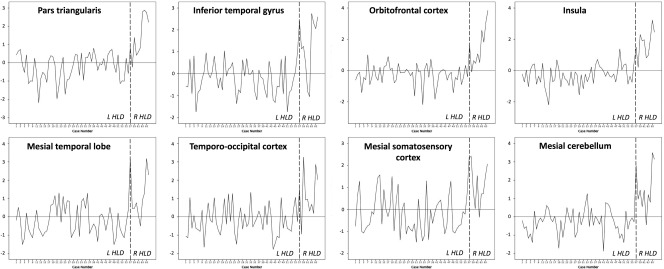
Figure 4.

Individual patient plots of standardized AIs for the eight clusters found to be significantly different between patients with left and right HLD. The standardized mean AI is 0 (horizontal line). A negative or positive value indicates the patients that show an AI pattern resembling the group level pattern in the left (L) HLD or right (R) HLD group, respectively. Patients with a positive standardized AI in the left HLD group and those with a negative standardized AI in the right HLD group do not show consistency with the group level pattern for each region. The number and percentage of patients showing consistency is provided in Table 3. The broken vertical line indicates the division between patients with left and right HLD
