
Figure 1.
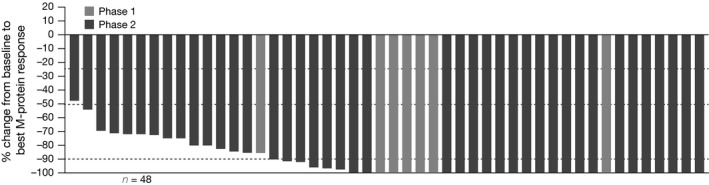
Waterfall plot of best M‐protein response, among response‐evaluable patients treated at the recommended phase 2 dose (modified intent‐to‐treat population).
Official websites use .gov
A
.gov website belongs to an official
government organization in the United States.
Secure .gov websites use HTTPS
A lock (
) or https:// means you've safely
connected to the .gov website. Share sensitive
information only on official, secure websites.
Waterfall plot of best M‐protein response, among response‐evaluable patients treated at the recommended phase 2 dose (modified intent‐to‐treat population).