Figure 4.

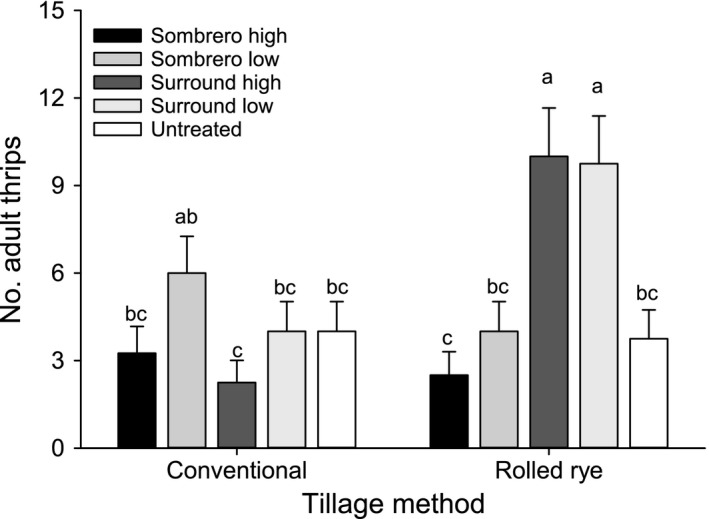
Mean (+ SE) sum of adult thrips in peanut treated with tillage and particle film for the 2nd week of sampling in 2014. Means capped with the same letter are not significantly different (LSMEANS test: P>0.05).

Mean (+ SE) sum of adult thrips in peanut treated with tillage and particle film for the 2nd week of sampling in 2014. Means capped with the same letter are not significantly different (LSMEANS test: P>0.05).