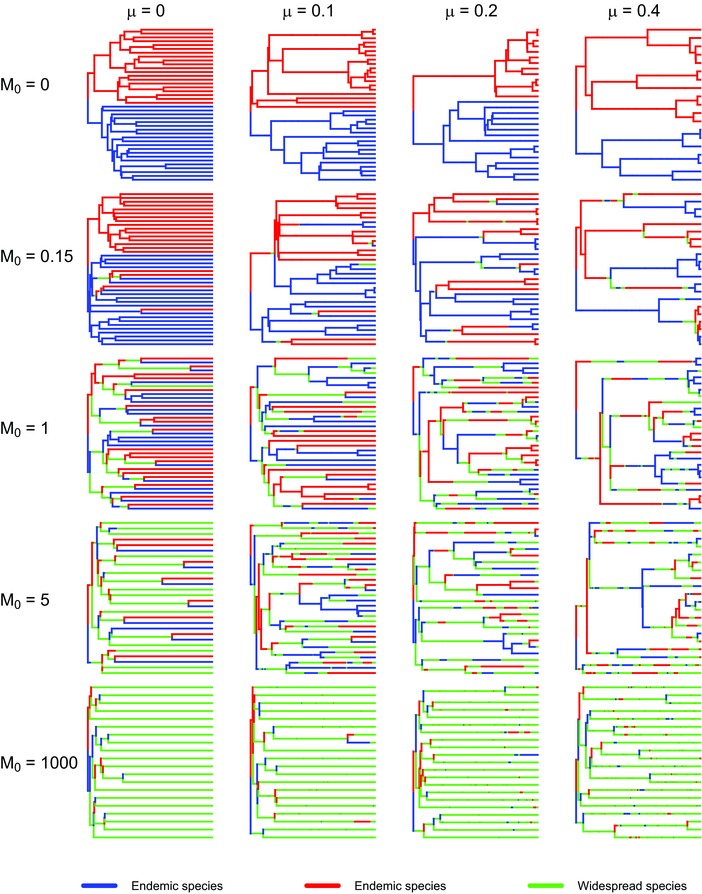
Figure 1.

Examples of phylogenetic trees produced in Scenario 1. Because the trees for migration rates between 0 and 1 are very similar, we only display five values of extinction () . The branches are colored by the location of species. Sympatric speciation and allopatric speciation are also distinguishable by the color of the nodes and the daughter species.
