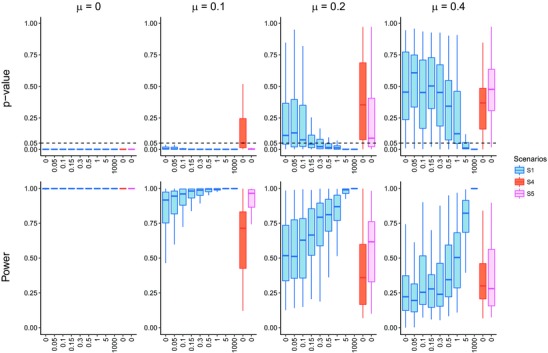
Figure 5.

P‐values and powers of the test of spatial Scenario 1 and nonspatial Scenarios 4 and 5: as the dispersal rate increases, the P‐value declines approaching 0 while the power of the test rises up to 1. The signal of diversity‐dependence tends to be detected with high dispersal and low extinction. Especially, in the case of the pure birth process, all the scenarios show such a strong signal that the distribution bars of P‐values and powers are compressed to thick black lines. When extinction rate is 0.4, diversity‐dependence is not detected statistically until dispersal rate reaches 1. In the box plots, thick solid lines, boxes and whiskers denote the percentiles of 50, 75, and 95%, respectively.
