
Figure 6.
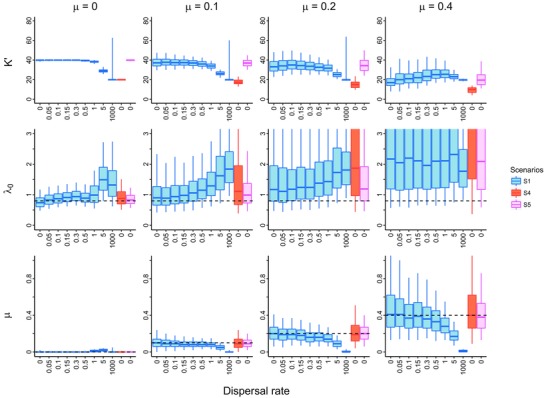
Maximum‐likelihood estimates for the ecological limit parameter , speciation rate and extinction rate for all the parameter settings of spatial Scenario 1 versus nonspatial Scenarios 4 and 5. The dashed lines indicate the values used in the simulations. In the box plots, thick solid lines, boxes, and whiskers denote the 50, 75, and 95% percentiles, respectively.