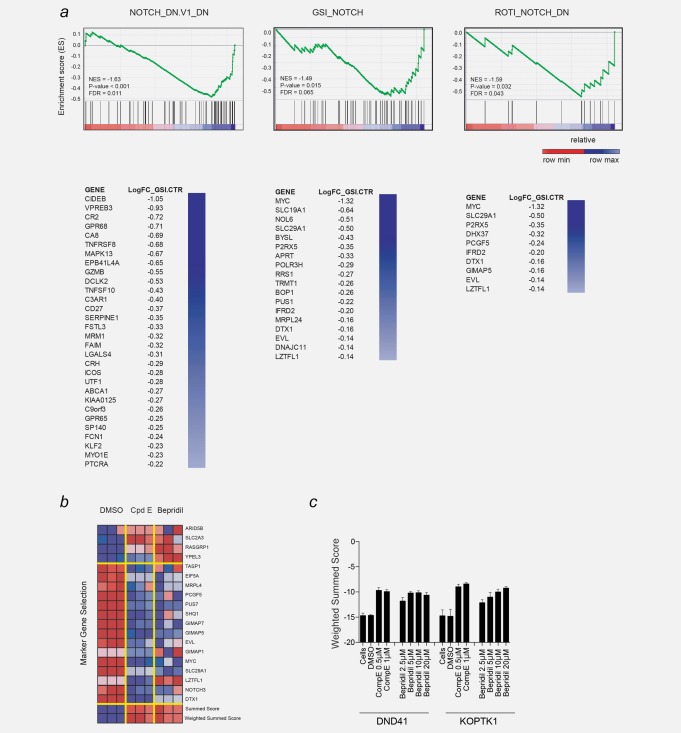
Figure 1.

A transcription‐based screens identified bepridil as a NOTCH modulator. (a) GSEA plot showing the enrichment of the genes downregulated by gamma secretase inhibitor knockdown in the three NOTCH abrogation signature. p < 0.001, computed using the permutation test for gene set enrichment implemented in the GSEA v2.0.14 platform. Significantly enriched genes are ranked in columns. (b) Following treatment of DND41 cells for 72 hr with either DMSO (0.08%), GSI (compound E, 1 µM) or bepridil (20 µM) the expression levels of 19 genes that define a T‐ALL‐specific NOTCH1 signature were measured with a ligation‐mediated amplification/fluorescent bead‐based detection system. Each column represents an independent experimental replicate. Dark red indicates high gene expression and dark blue low gene expression. NOTCH marker gene expression is depicted as a ratio of the expression of the marker gene above or on the mean of four control genes. The summed score combines expression ratios by summing them with a sign determined by the expected direction of regulation as determined from the positive controls (GSI‐treated). The weighted summed score metric is a variant of the summed score metric that combines expression ratios by summing them with weight and sign determined by the signal‐to‐noise ratio of the positive control (GSI‐treated) and negative controls (DMSO‐treated). (c) Induction of NOTCH1 off abrogation signature (weighted summed score) measured by GE‐HTS in DND41 cells treated with the indicated concentrations of bepridil for 72 hr. Error bars denote the mean ± SD of eight replicates for untreated cells, and the mean ± SD of four replicates for the DMSO, bepridil and compound E (GSI)‐treated cells.
