Figure 2.

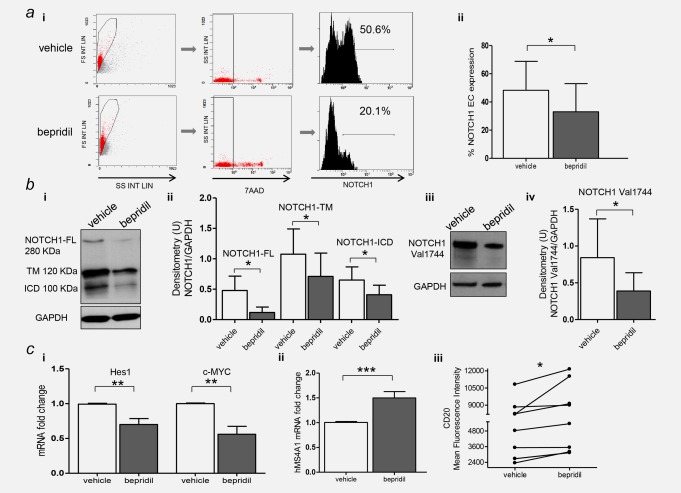
The antitumor efficacy of bepridil was associated with inhibition of NOTCH1 activity. (a) Representative flow cytometry histogram of the expression of the extracellular (EC) bound portion of NOTCH1 in CLL cells incubated with bepridil or vehicle control (i). Bar graphs show the means ± SD of NOTCH1‐EC fluorescence in 23 treated cases (ii). (b) Representative western blot (i) and quantitative densitometry analysis (ii) of the full‐length (FL), transmembrane (TM) and intracellular domain (ICD) forms of NOTCH1 protein levels in bepridil‐treated CLL compared to vehicle controls. Representative western blot (iii) and quantitative densitometry analysis (iv) of the anti‐NOTCH1(Val1744) antibody. Densitometry units (U) were calculated relative to GAPDH. (c) Analysis of HES1, c‐MYC (i) and hMS4A1 (ii) gene expression in CLL cells treated with bepridil (N=10). mRNA levels were normalized to GAPDH and represented as fold change using untreated cells as a reference. Panel (iii) shows a dot‐and‐line diagram of the CD20 Mean Fluorescence Intensity levels in primary CLL cells. Results are the mean ± SD of all the samples analyzed. The corresponding p‐values are reported. *p <0.05, **p < 0.01, ***p < 0.001 according to Student's test. [Color figure can be viewed at http://wileyonlinelibrary.com]
