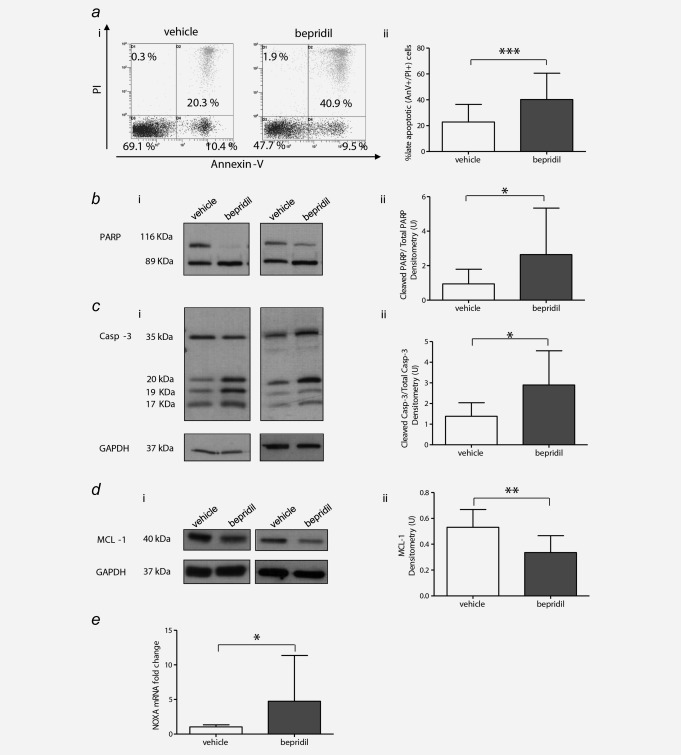
Figure 4.

Bepridil‐induced apoptosis of CLL cells in vitro. (a) Representative dot plots (i) and bar graph (ii) of Annexin V‐FITC/PI staining results of bepridil‐induced apoptosis in B cells from CLL patients (N = 66). (b–d) Representative western blots (i) and quantitative densitometry analysis (ii) of cleaved PARP, caspase‐3 and MCL1 protein levels in bepridil‐treated CLL compared to vehicle controls (N = 12, N = 7, N = 11). (e) Analysis of NOXA gene expression in CLL cells treated with bepridil (N = 10). mRNA levels were normalized to GAPDH and represented as fold change using vehicle‐treated cells as a reference. Resulted are the mean ± SD, *p < 0.05, **p < 0.01, ***p < 0.001 according to Student's test.
