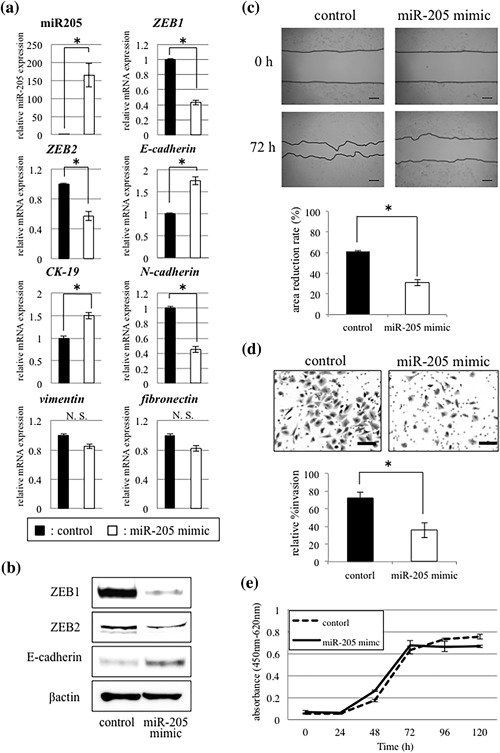
Figure 4.

Effects of miR‐205 mimic transfection in SQUU‐B cells. (a and b) Expression of ZEB1 and ZEB2 is decreased and E‐cadherin increased in the cells transfected with miR‐205 mimic. Up‐regulation of CK19 and down‐regulation of N‐cadherin are also seen (Mann–Whitney U‐test, *p < 0.05). However, there are no significant differences in the expression levels of vimentin and fibronectin. (c) Wound healing assay demonstrates that cell migration capacity is significantly inhibited in miR‐205‐overexpressing OSCC cells, compared with control cells at 72 hr. (Mann–Whitney U‐test, * p < 0.05). Scale bars; 200 µm. (d) miR‐205‐overexpressing cells show low invasion ability compared with control cells in Matrigel™ invasion assay (Mann–Whitney U‐test, *p < 0.05). Scale bars; 50 µm. (e) WST‐8 assay shows that there is no significant difference in the cell proliferation between miR‐205‐overexpressing cells and control cells (Mann–Whitney U‐test)
