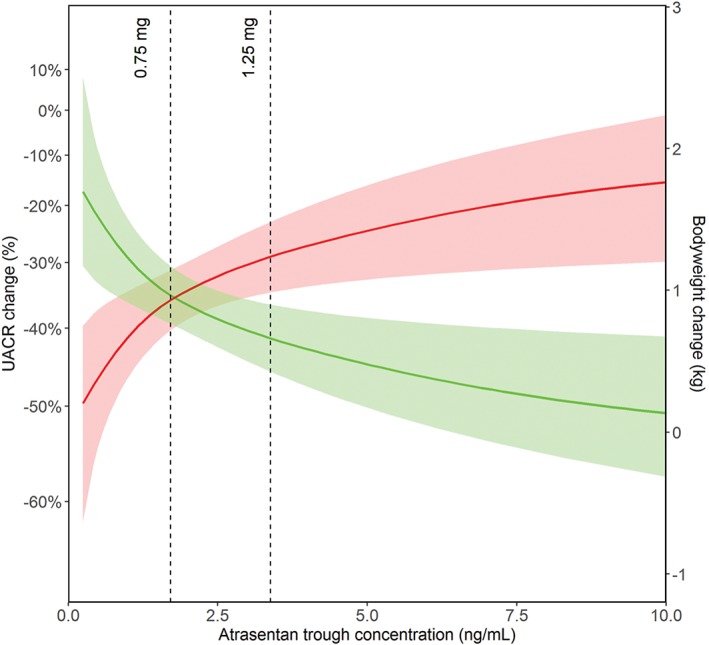
Figure 1.

Predicted atrasentan trough concentration versus predicted albuminuria (green) and predicted bodyweight response (red). The mean predicted response (solid line) is shown for the 95% prediction intervals (shaded areas). The dotted lines represent the mean atrasentan trough concentrations for 0.75 and 1.25 mg doses
