Figure 1.

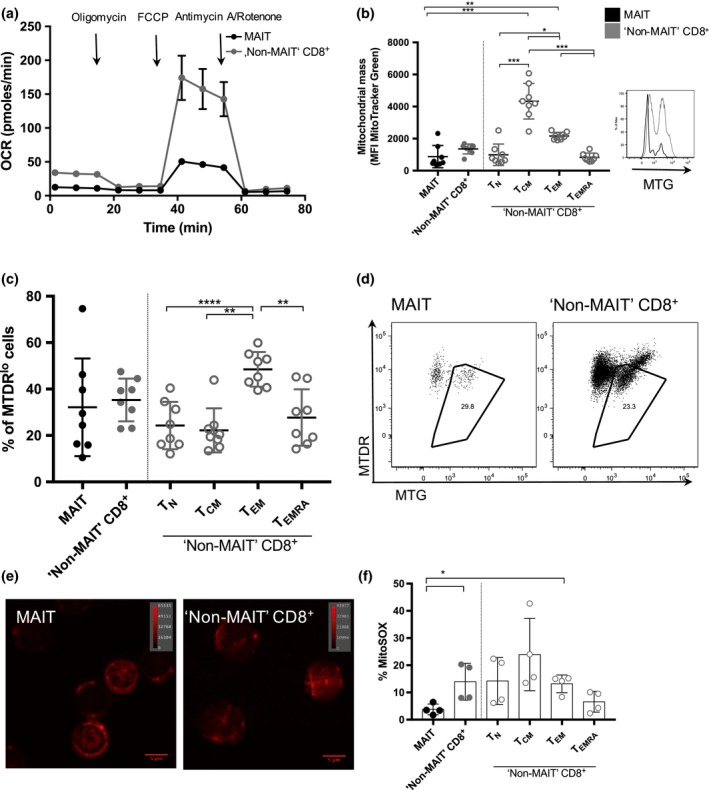
Decreased “mitochondrial activity” in MAIT cells. (a) Oxygen consumption rate (OCR) obtained during mitochondrial stress test, performed by injection of oligomycin, FCCP, antimycin A and rotenone showing decreased spare respiratory capacity (SRC) in MAIT cells versus “Non‐MAIT” CD8+ T cells. Sorted MAIT and “Non‐MAIT” CD8+ T cells were used from one healthy blood donor with a peripheral MAIT cell percentage of 32.8% of CD8+ T cells. (b) MitoTracker Green MFI of MAIT cells versus “Non‐MAIT” CD8+ T cells. “Non‐MAIT” T cells are further divided into the subsets TN,TCM,TEM and TEMRA (left). Significance was determined using a paired, parametric two‐tailed t‐test. Significance levels: * indicates P < 0.05, **P < 0.01, ***P < 0.001. Error bars show mean ± s.d. Data for n = 8 healthy donors are shown (representative of three independent experiments). Representative histogram for one donor showing staining for MitoTracker Green (MTG) staining (right). (c) MAIT cells versus “Non‐MAIT” CD8+ T cells (constituted of TN,TCM,TEM and TEMRA) with depolarized mitochondria identified as positive for MTG and expressing low levels of MitoTracker DeepRed (MTDR lo). Data for n = 8 healthy donors are shown (representative of three independent experiments). (d) Representative gating strategy for one donor for cells containing depolarized mitochondria showing both MAIT cells and “Non‐MAIT” CD8+ T cells. (e) Confocal image showing sorted MAIT cells (left) and “Non‐MAIT” CD8+ T cells (right) stained for MitoTracker DeepRed. Data from one healthy donor are shown. The magnification applied is 63× manually and further 3.6× using ZEN black software (Zeiss). The indicated lookup table is linear and covers the full range of the data. (f) Mitochondrial production of reactive oxygen species (ROS) measured by frequency of MitoSOX positive cells comparing MAIT cells and “Non‐MAIT” CD8+ T cells. “Non‐MAIT” CD8+ T cells were further subdivided into TN,TCM,TEM and TEMRA. Significance was determined using a paired, parametric two‐tailed t‐test. Significance levels: * indicates P < 0.05, **P < 0.01, ***P < 0.001. Error bars show mean ± s.d. Data are shown from n = 4 healthy donors (representative of two independent experiments).
