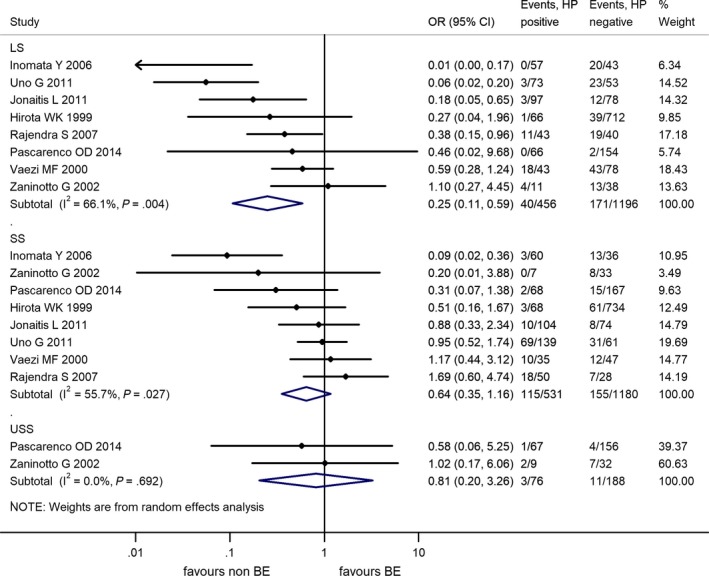
Figure 3.

Forest plot of the random effect analysis of the 7 studies included in the subgroup analysis for different segment lengths of Barrett's esophagus. LS, long segment; SS, short segment; USS, ultrashort‐segment Barrett's esophagus; OR, odds ratio, CI, 95% confidence interval; HP, Helicobacter pylori, weights of studies and heterogeneities are indicated too
